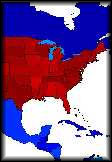
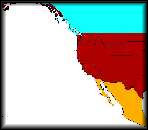
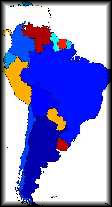
The following graphics show the daily amount of energy incident
on the ground for a given day. These values are calculated
using GOES-9, GOES-10, GOES-12 and METEOSAT-7 visible satellite
images for each daylight hour. The approximate amount
of energy reaching the ground is calculated for each image.
This model takes into account the effect of clouds if there
are clouds present. Every night, the images are integrated
together to give the estimated total amount of energy reaching
the ground from the sun.
These values are based on a model developed by Dr. George Diak
(CIMSS) and Dr. John Mecikalski (CIMSS/University of Alabama
in Huntsville).
Contact person: Dr. John R. Mecikalski
Email: john.mecikalski@nsstc.uah.edu
For more information about how these values are calculated see:
Diak, G. R., W. L. Bland, and J. R. Mecikalski.
"A note on first estimates of surface insolation
from GOES-8 visible satellite data." Ag. For. Meteor. 1996:
82, 219-226.
Otkin, J. A., M. C. Anderson, G. R. Diak, and J. R.
Mecikalski, 2004: Vaidation of GOES-based insolation
estimates using data from the United States climate reference
network. Submitted. J. Hydrometeor.
Insolation
Plots:
Eastern North America
Western North Americ
South America
Florida
Other Solar Insolation Images:
CIMSS
Land Surface Group
UW
Soil Science Web Page
|
|
South
America Plot Information |
 |
•
Latest
Plot
• Noon Satellite Image
|
|
back
to top