|
To manage training grounds and the local ecosystem, the Fort Stewart-Hunter Army Airfield Forestry Branch, in conjunction with the US Forest Service, preforms prescribed burns across the installation at regular intervals each year. However, in the spring of 2022 and late winter of 2024, the base hosted scientists that are a part of the Integrated Research Management Team (IRMT), a collaborative effort between research institutions, the US Forest Service, and Department of Defense, for these prescribed burns. The burns provided a perfect opportunity for researchers to collaborate on efforts to better understand fire behavior, smoke plume characteristics, and fuel consumption.
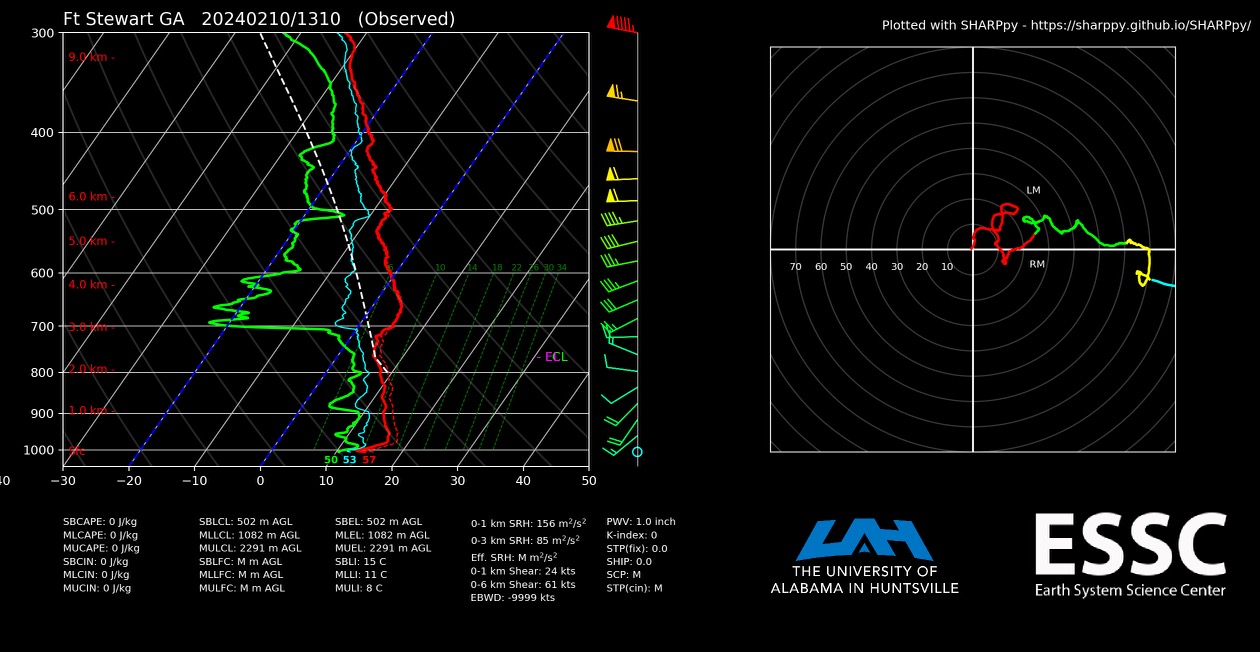
As part of this collaboration, the MAPNet MoDLS was deployed to document the atmospheric boundary layer in and around the fire, investigate the smoke plume, and provide real-time boundary layer winds and mixing height to the crews on site. Doppler lidar observations were also coordinated with another Doppler lidar operated by a small crew from San Jose State University to achieve dual doppler winds within the smoke plume. A sounding that was launched from the MoDLS site the morning of the fire indicated a boundary layer capped at approximately 500 m. The lidar vertical measurements indicated this persisted throughout the morning due to the presence of clouds. Once the smoke plume was present, plan position indicator (PPI) sector scans in the direction of the plume were added to document the structure and evolution of the plume. Low level lidar and surface wind retrievals showed slight veering and acceleration of winds into the fire shortly after maturity. 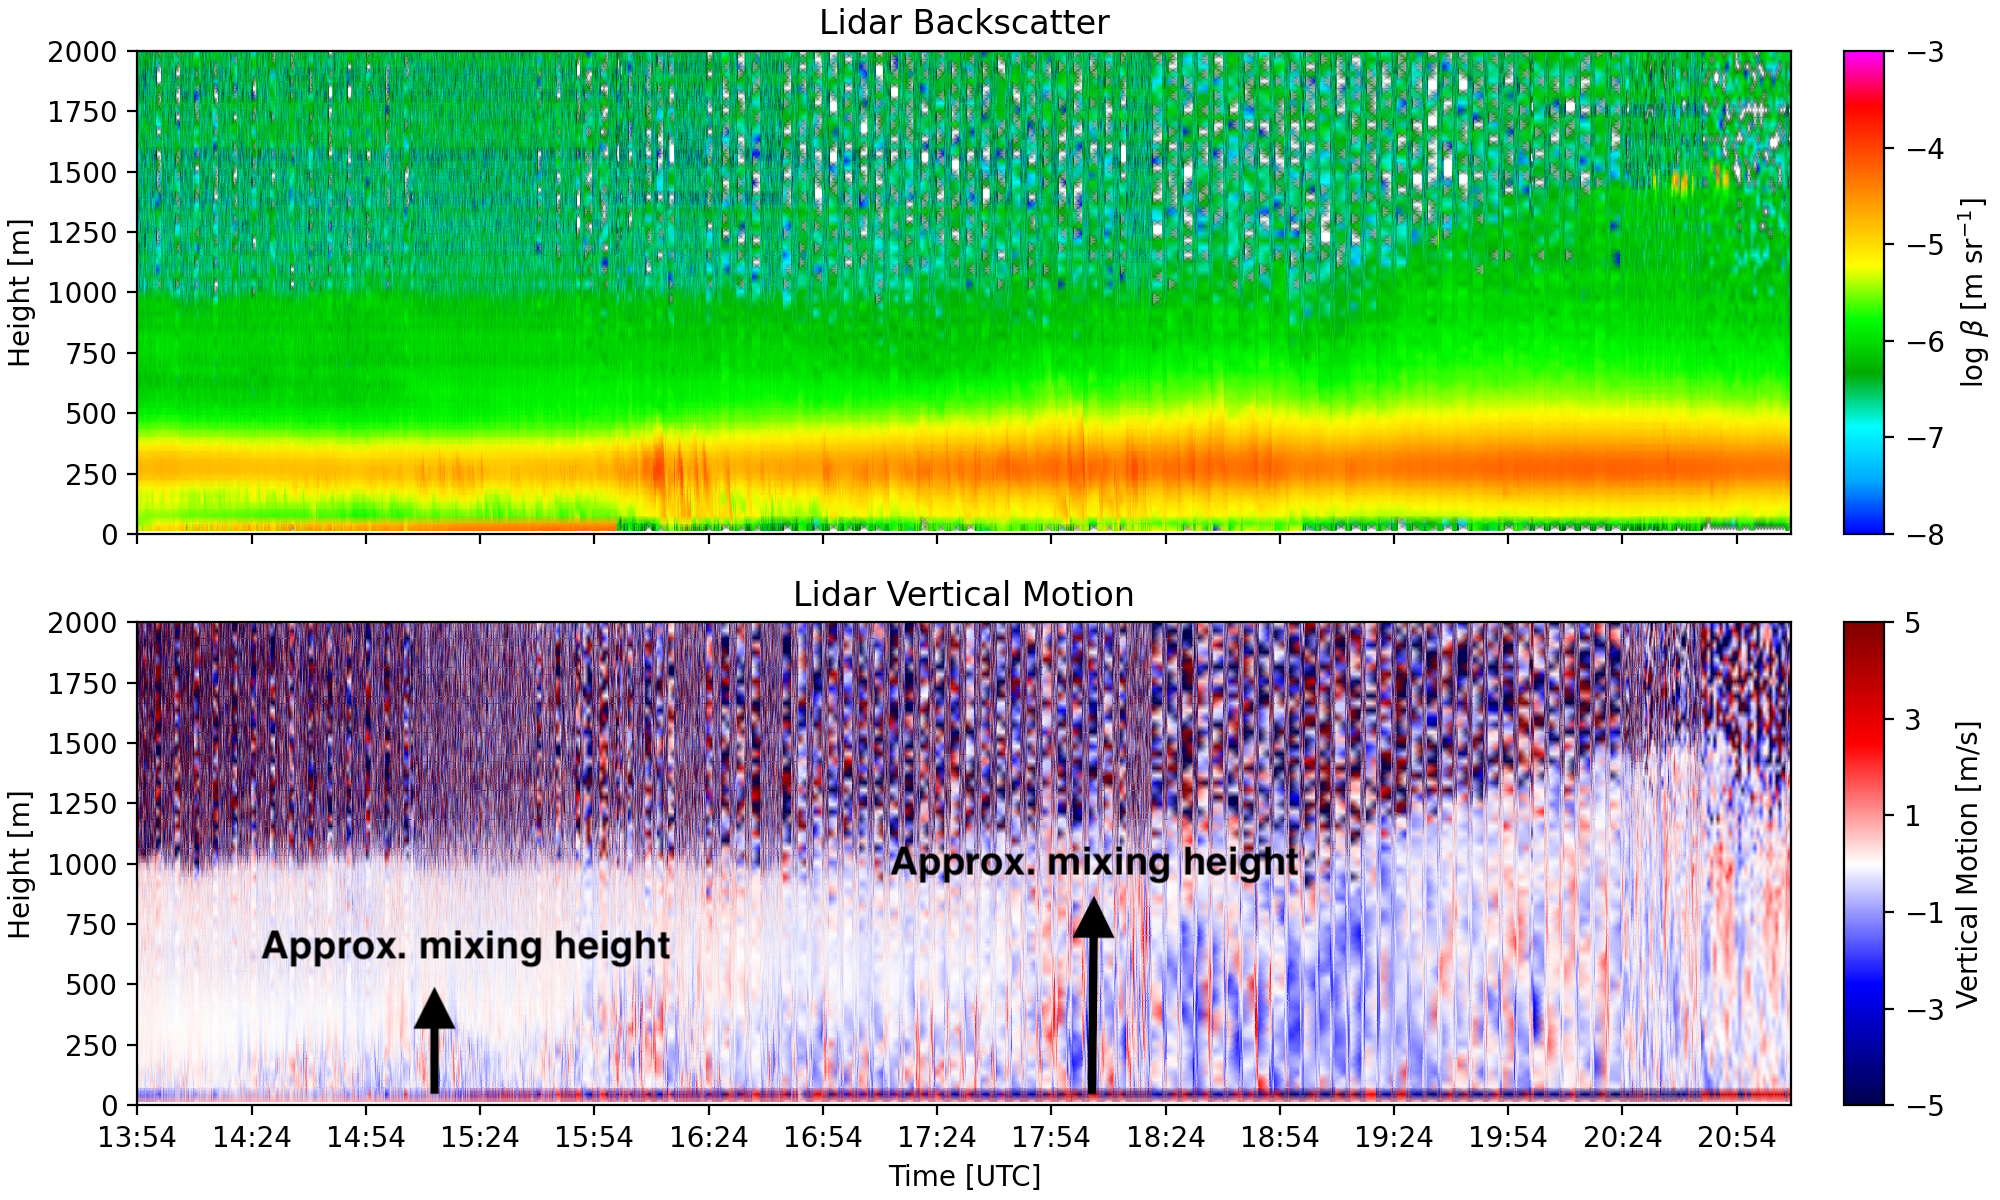 Lidar derived vertical backscatter (top) and vertical velocity (bottom). Positive values indicate upward motion while negative values indicate downward motions. Increase in turbulence becomes present around 1800Z as high-level clouds thinned out. Additionally, the hight of the mixing layer is extended to ~800 m. The higher backscatter seen between 250 and 500 m is evidence of pollen that was present during operations. |
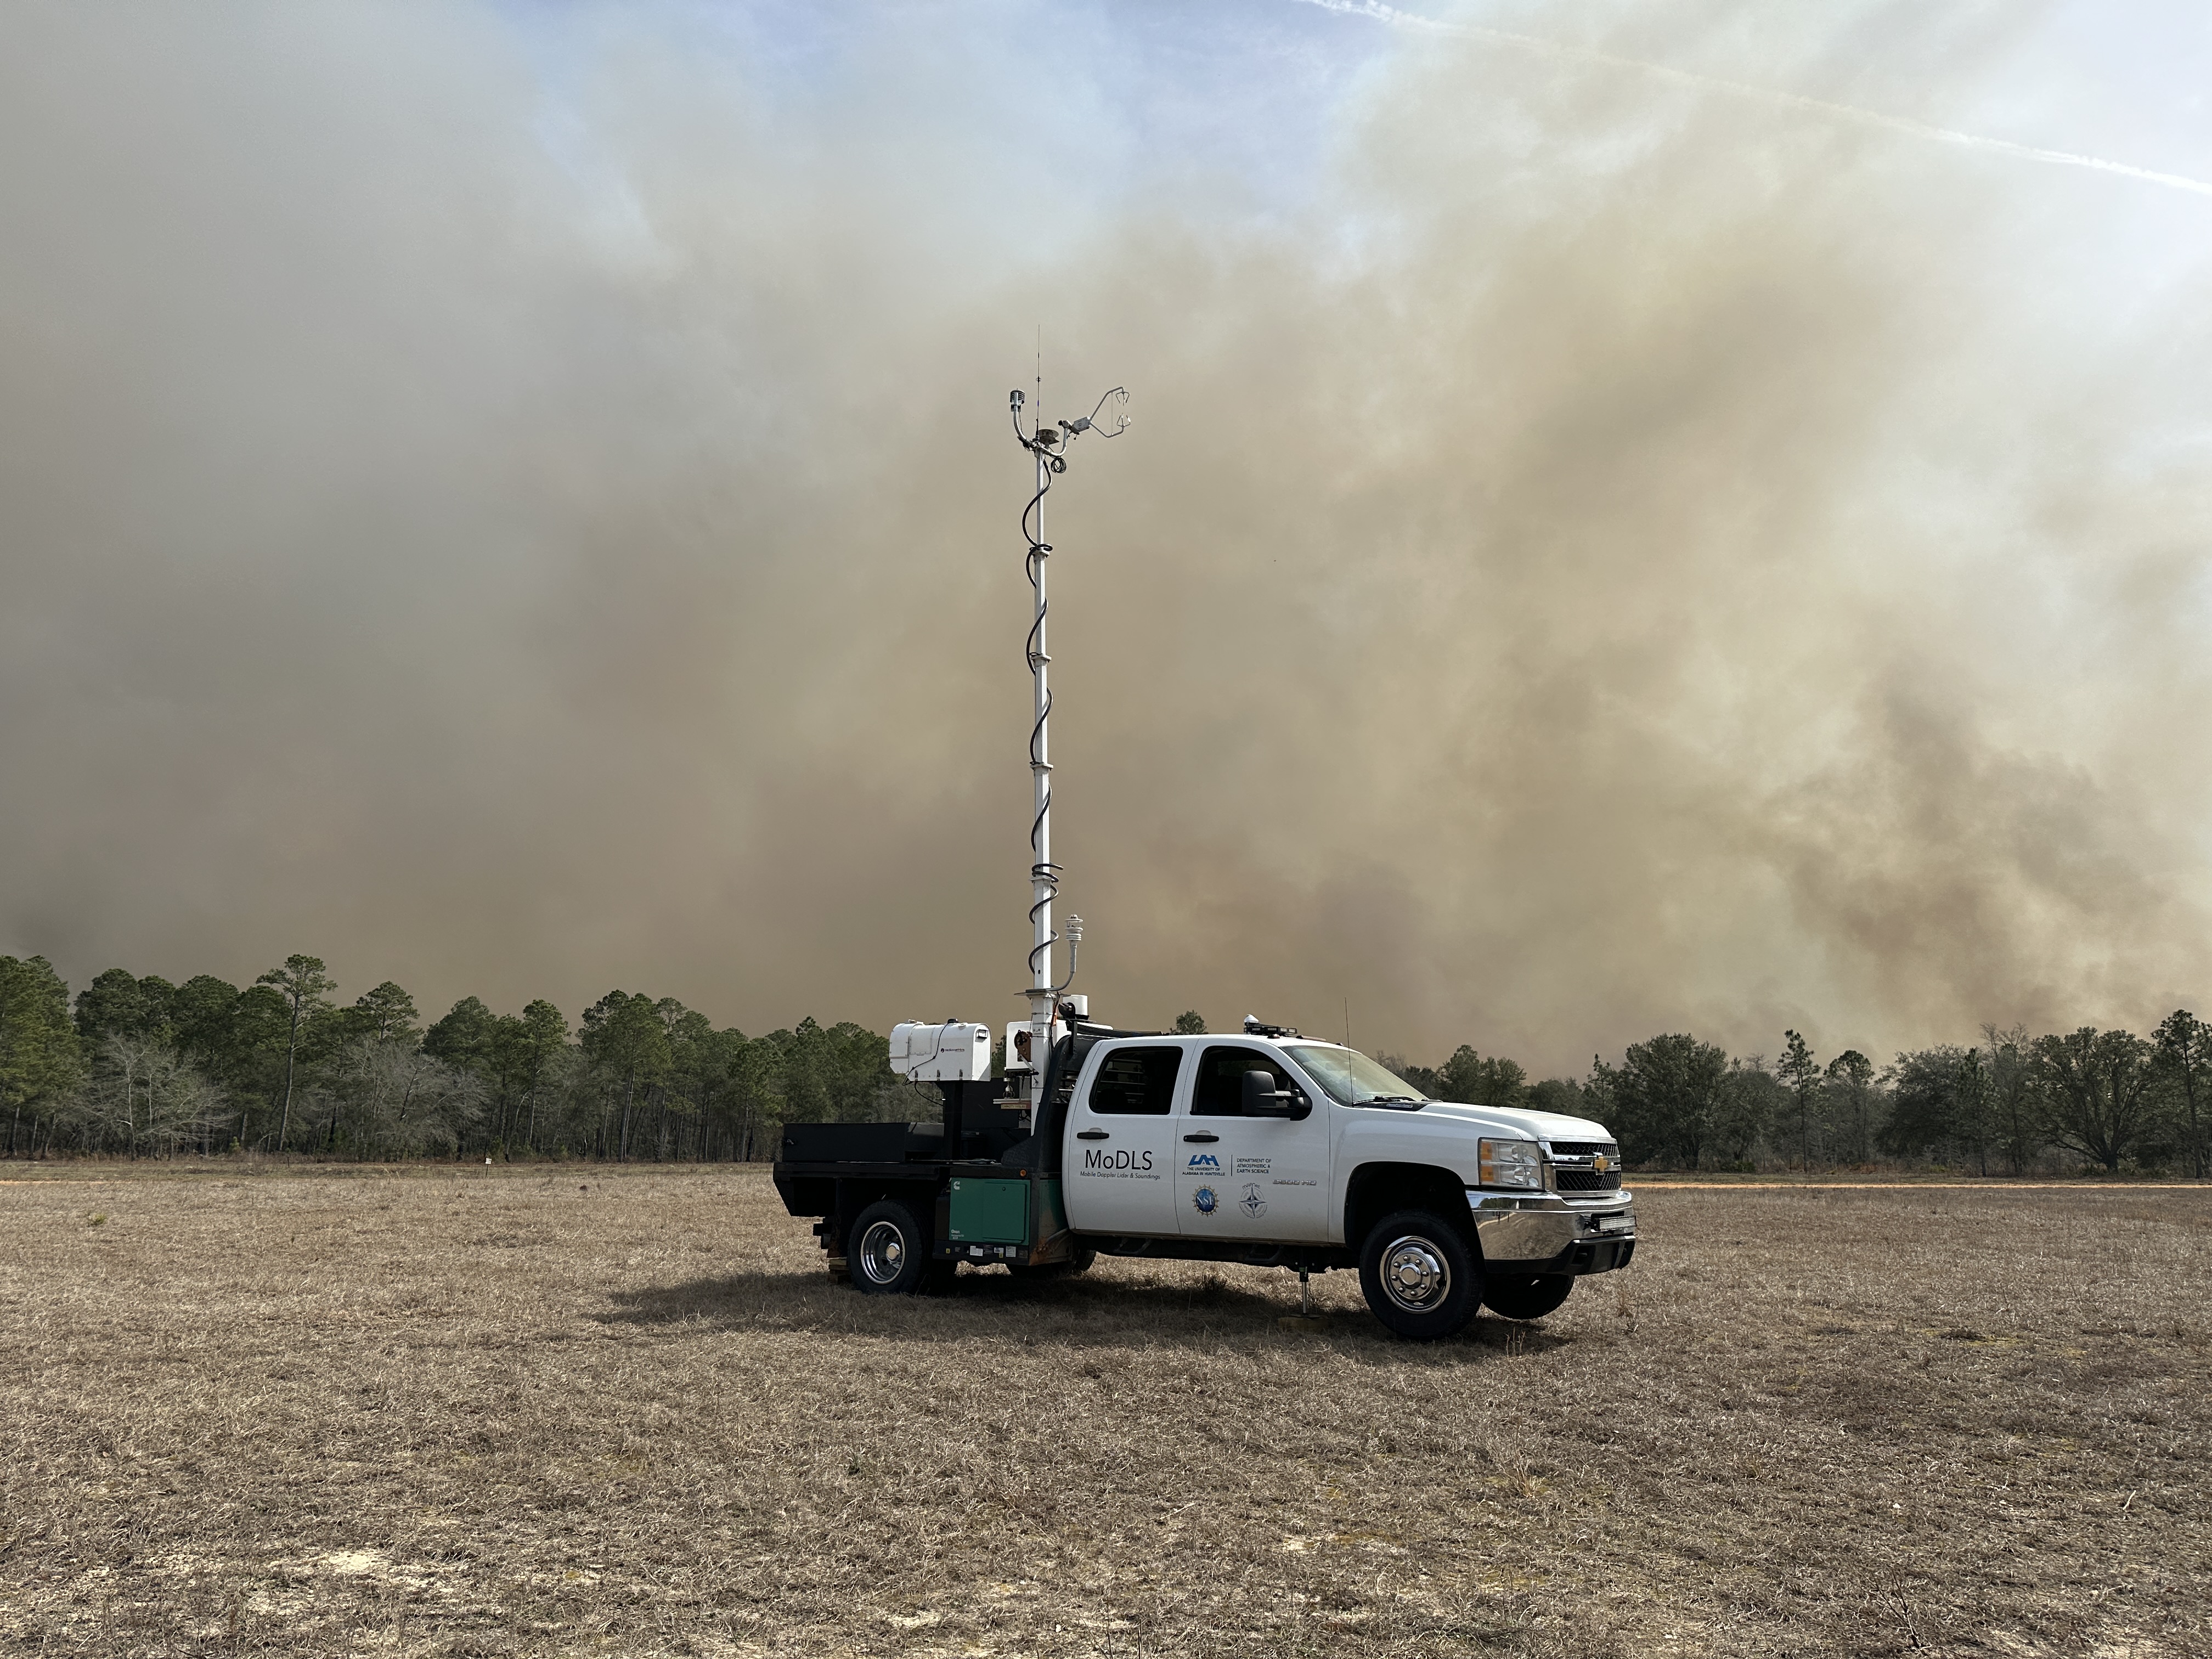
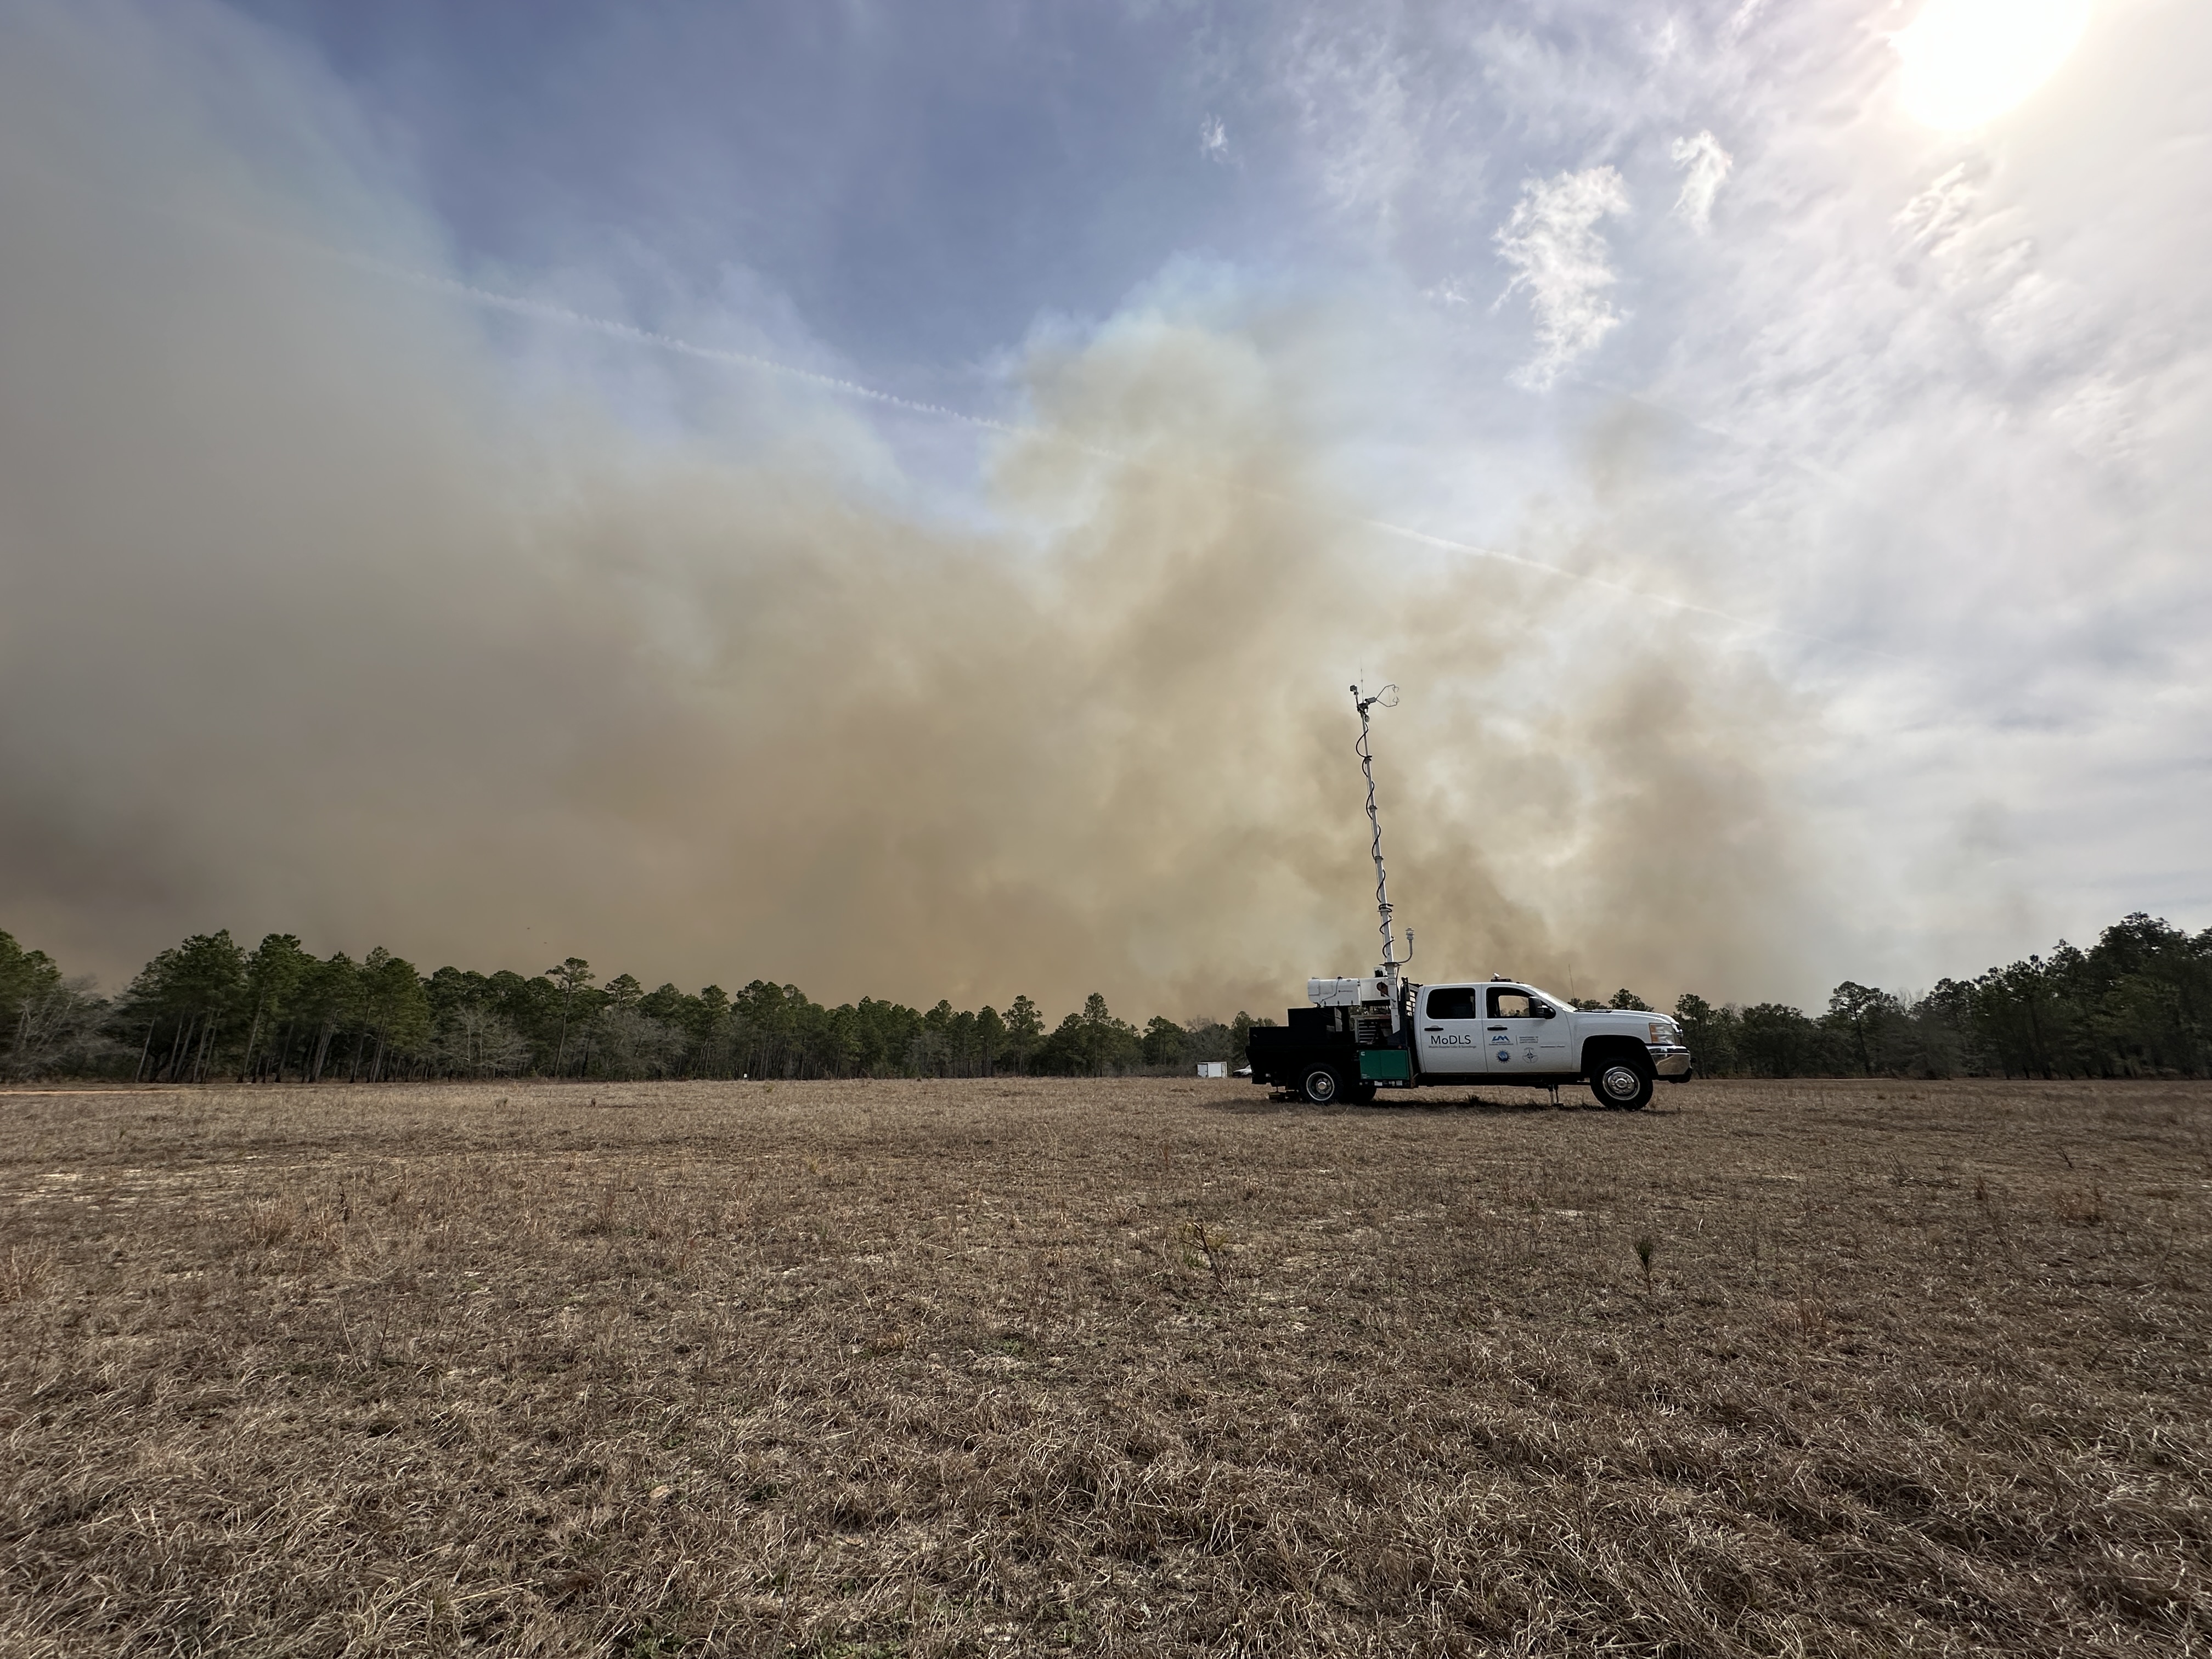
The MoDLS deployed upwind of the smoke. 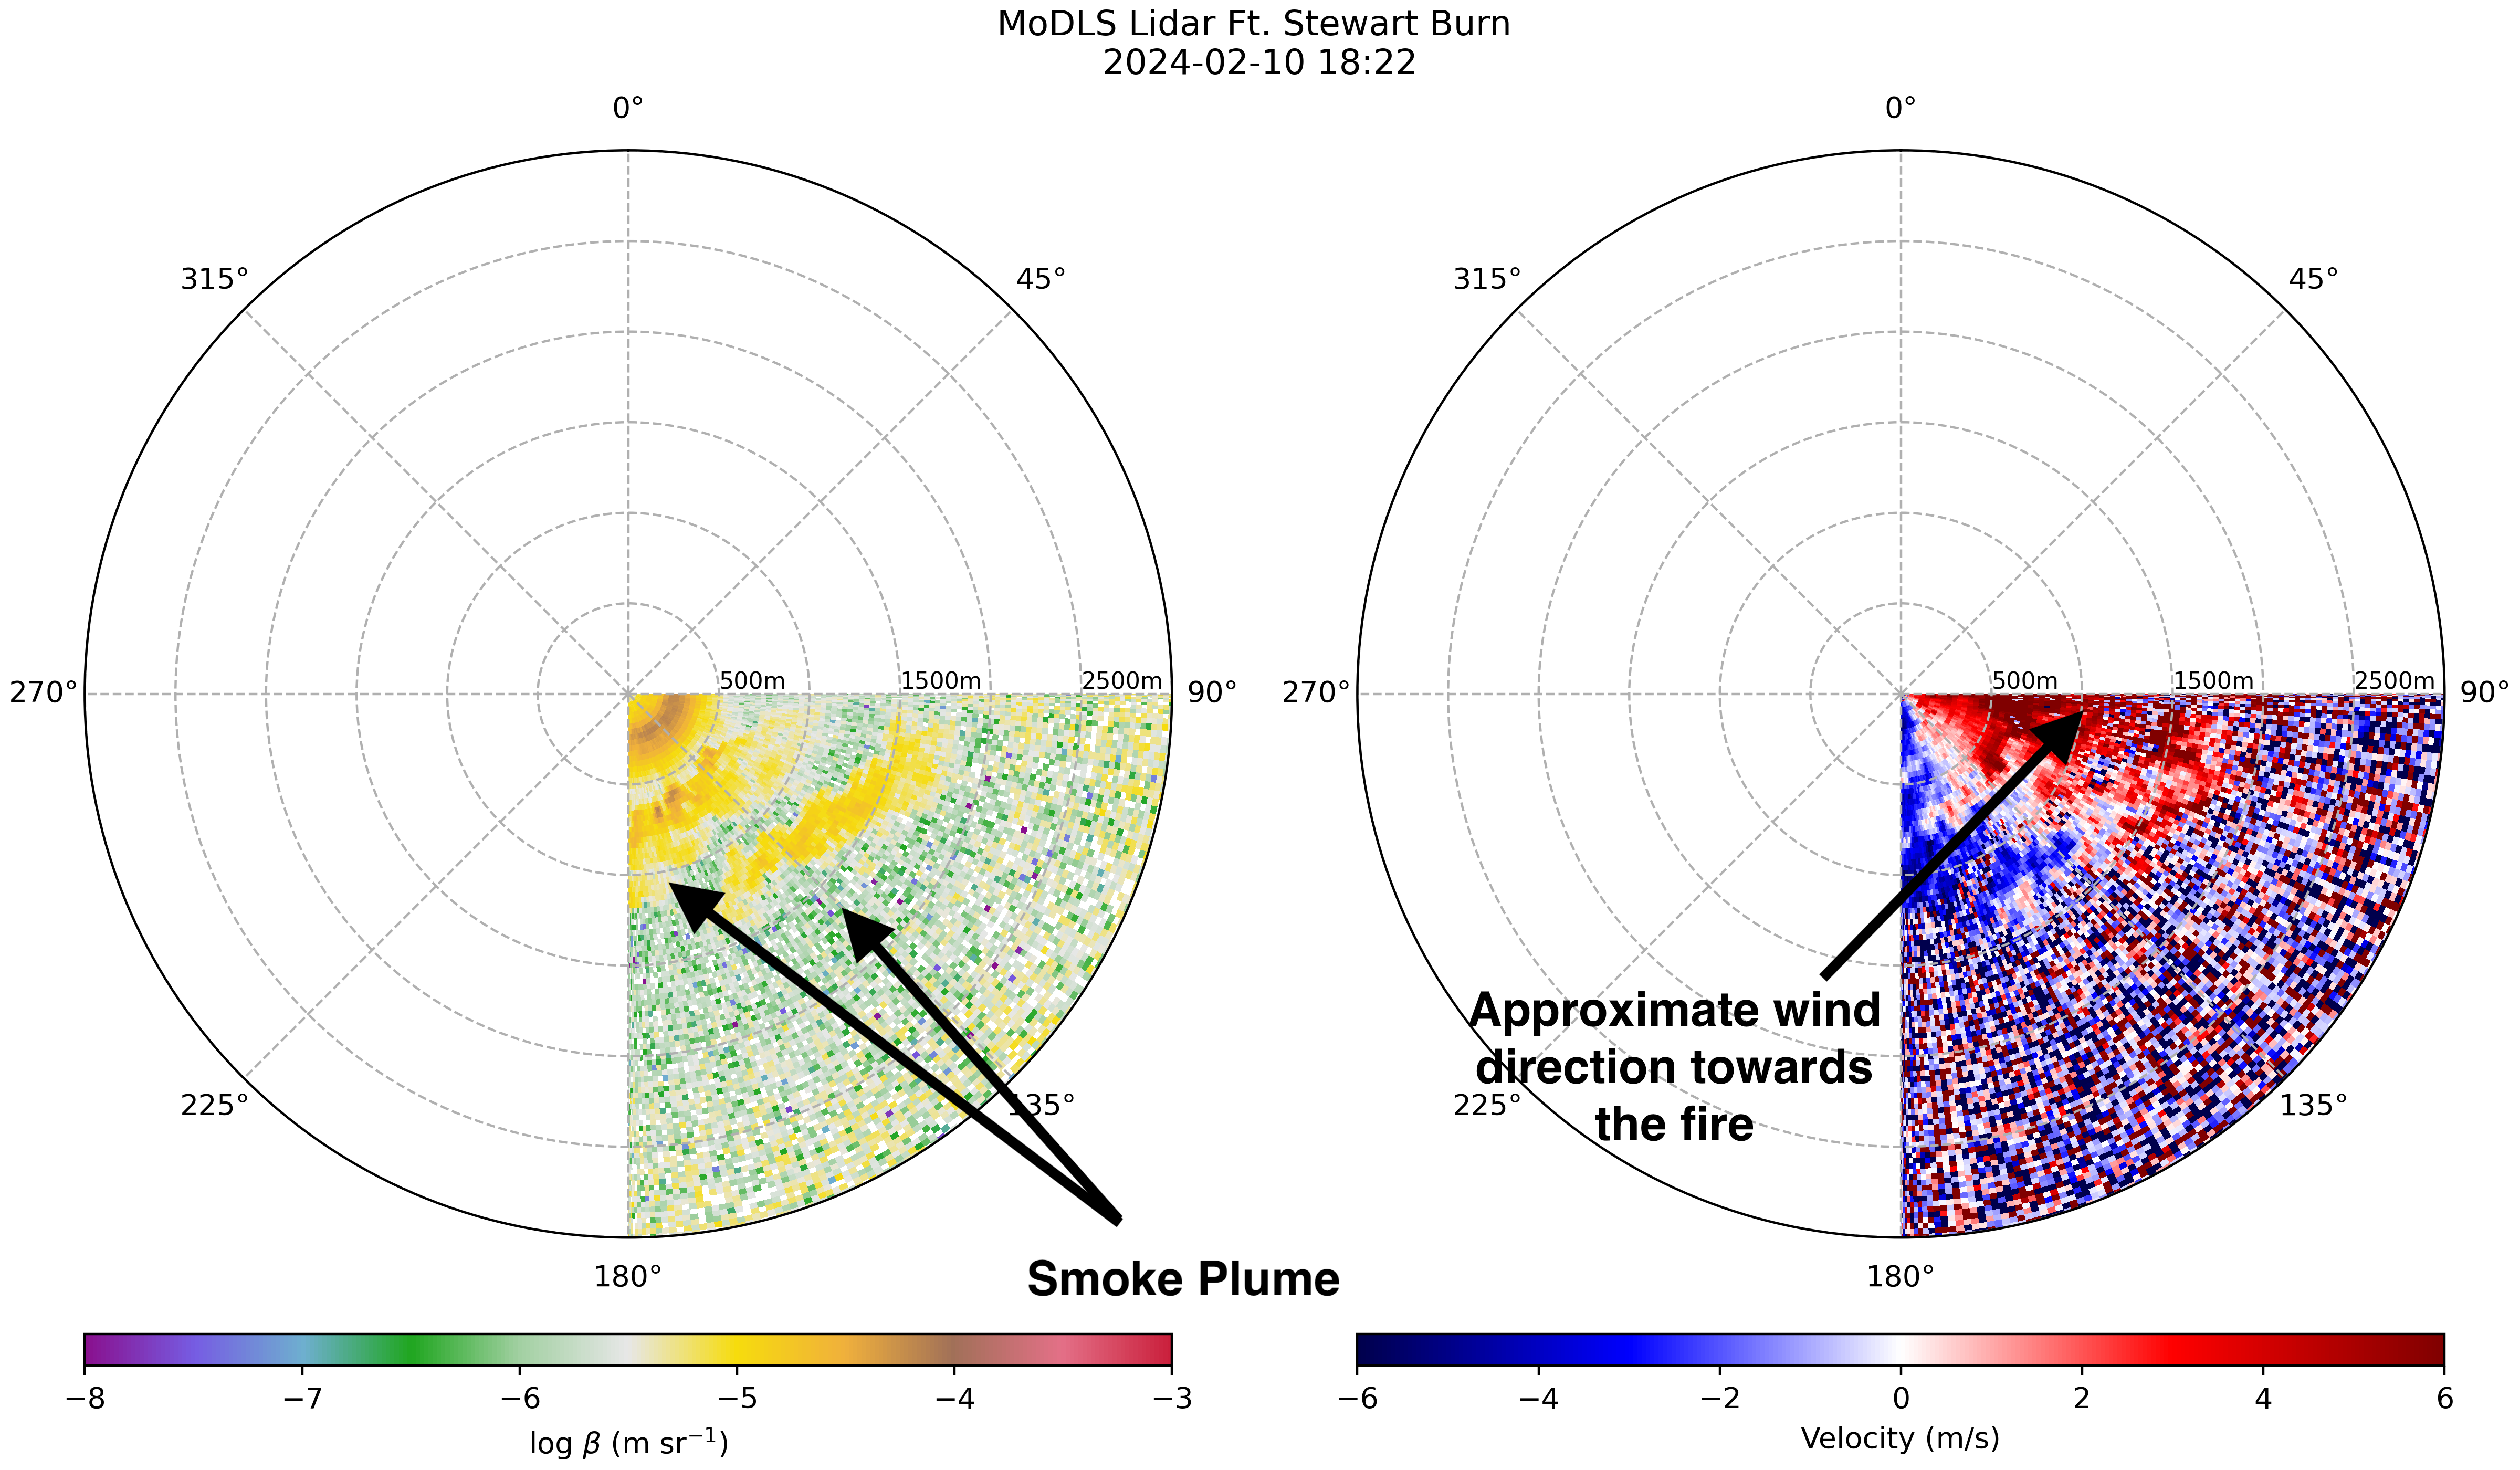
A Plan Position Indicator (PPI) image from the lidar showing the smoke plume size and structure. Velocity data show SW wind which elongated the smoke plume towards the NE. 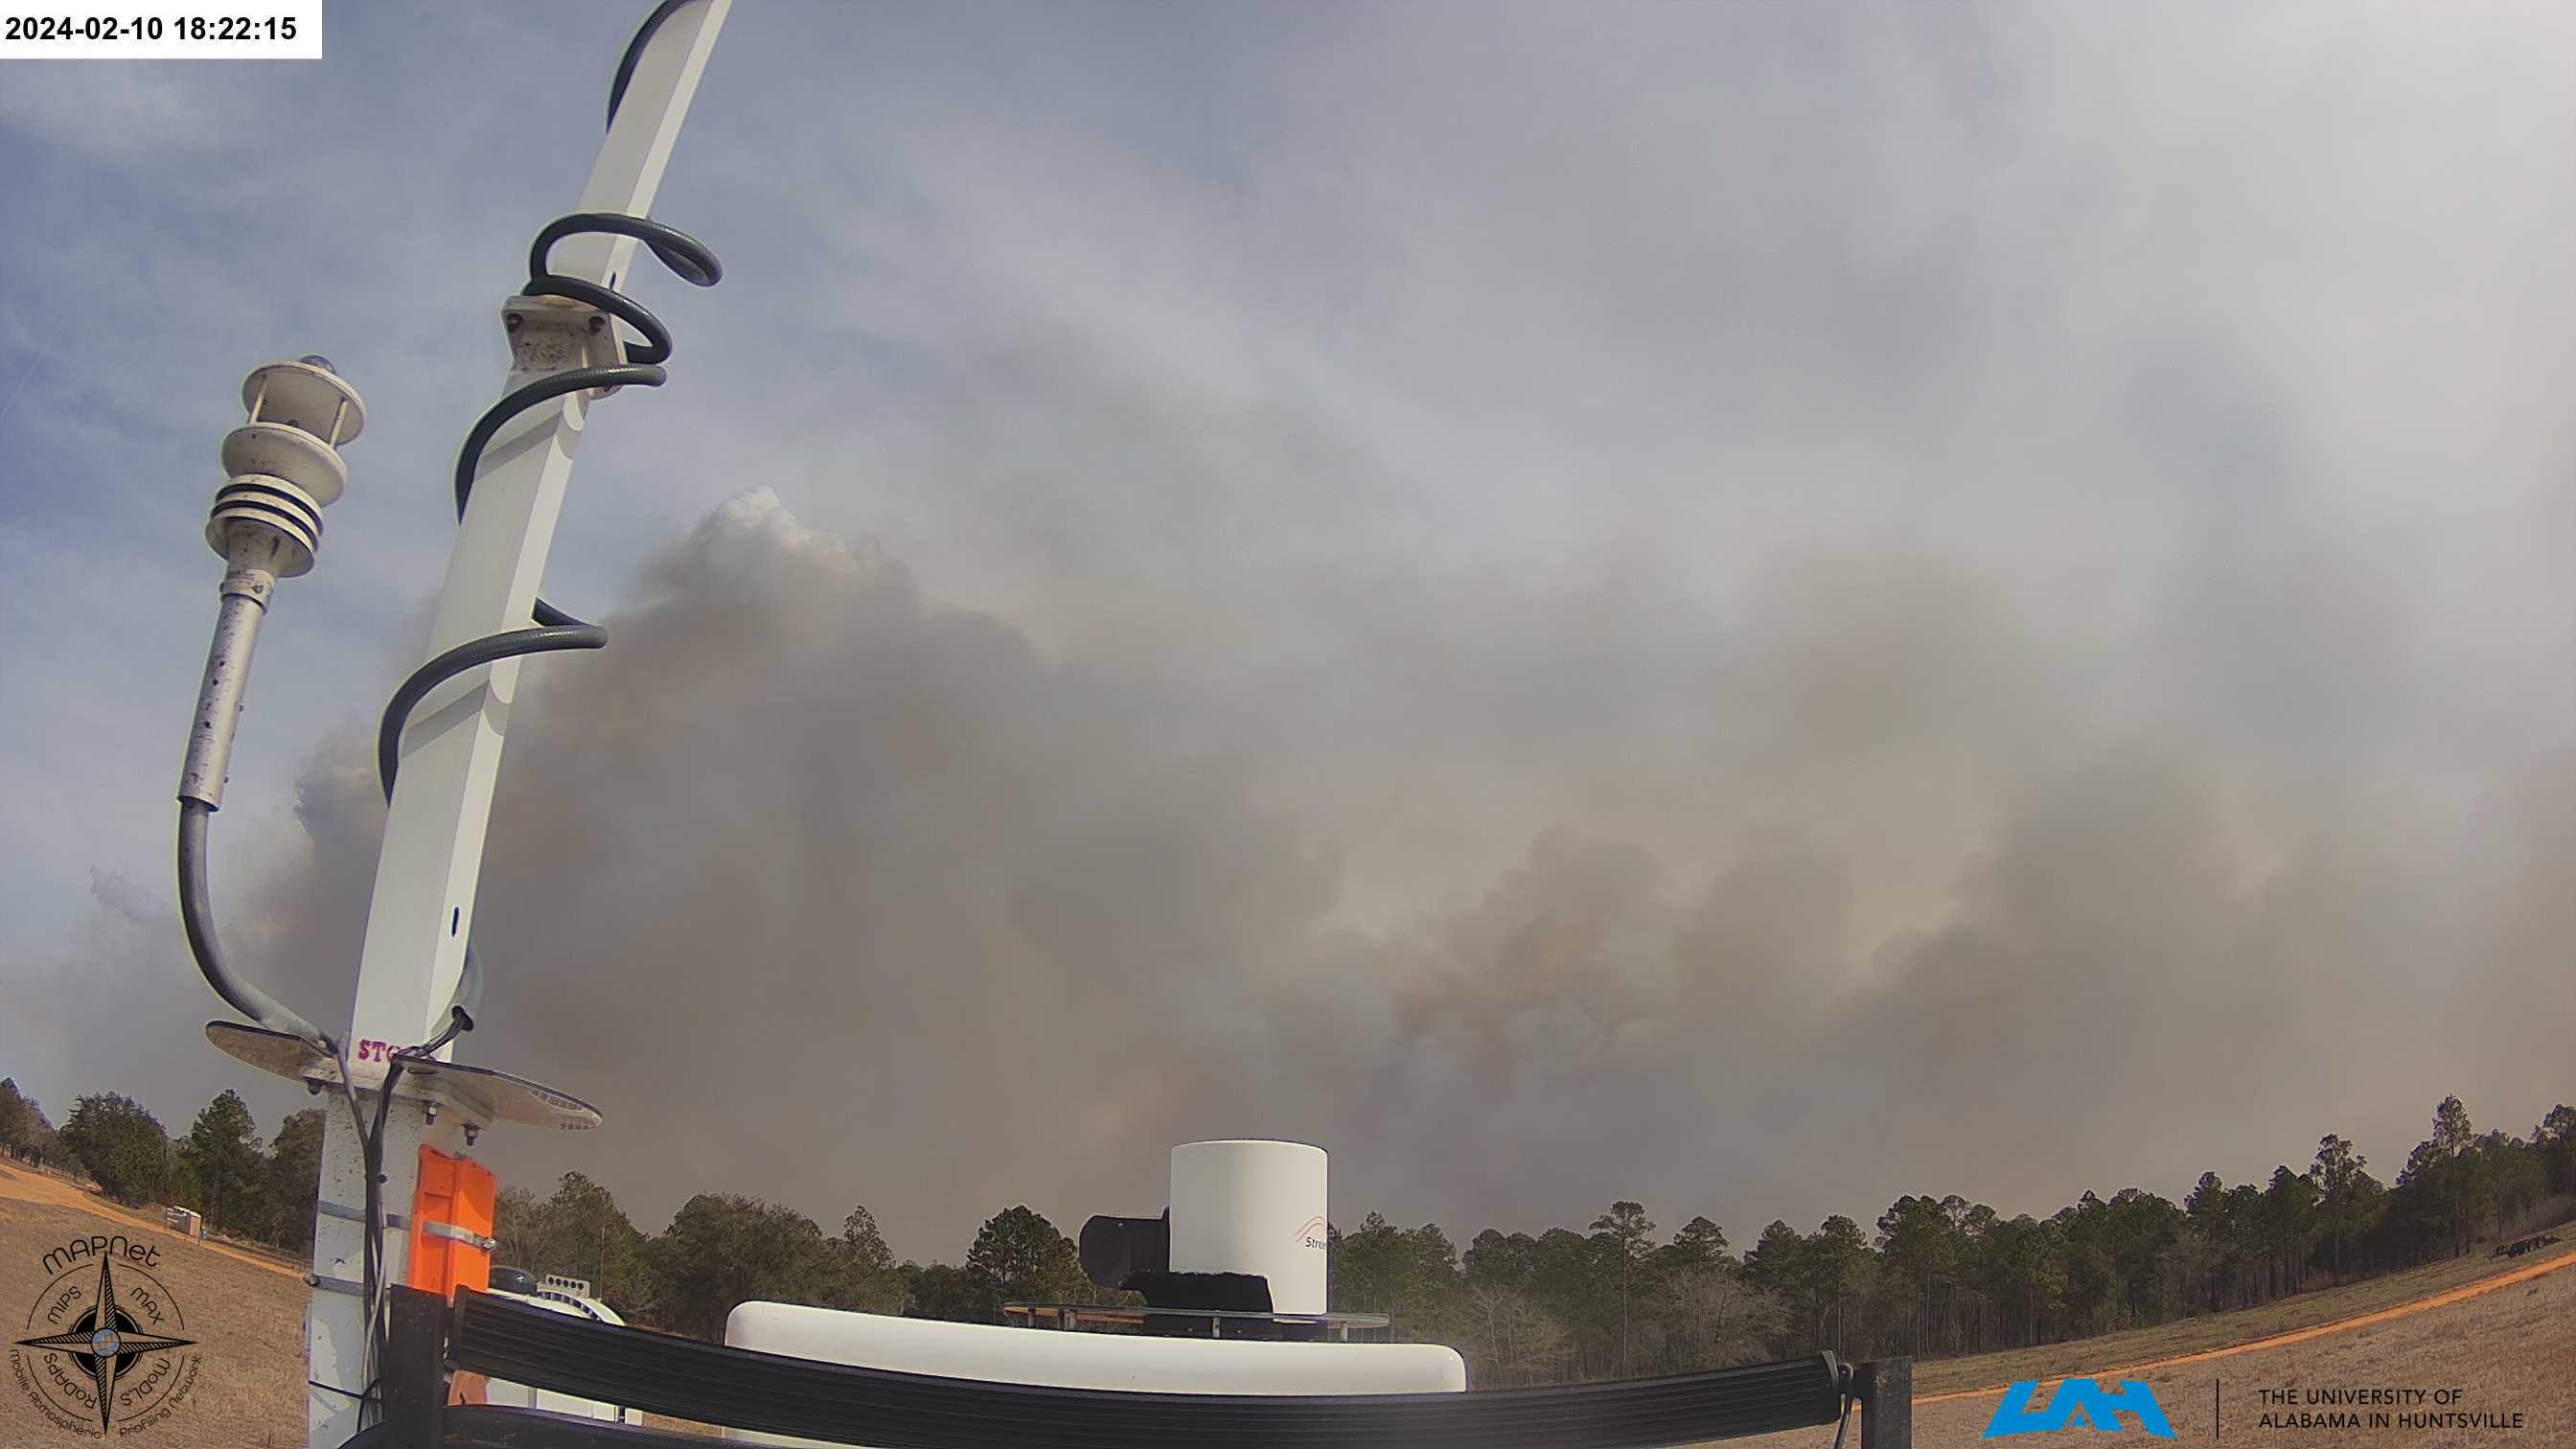
An image taken from the camera onboard MoDLS at the same time as the PPI image above. An animation of the smoke plume starting at ignition. 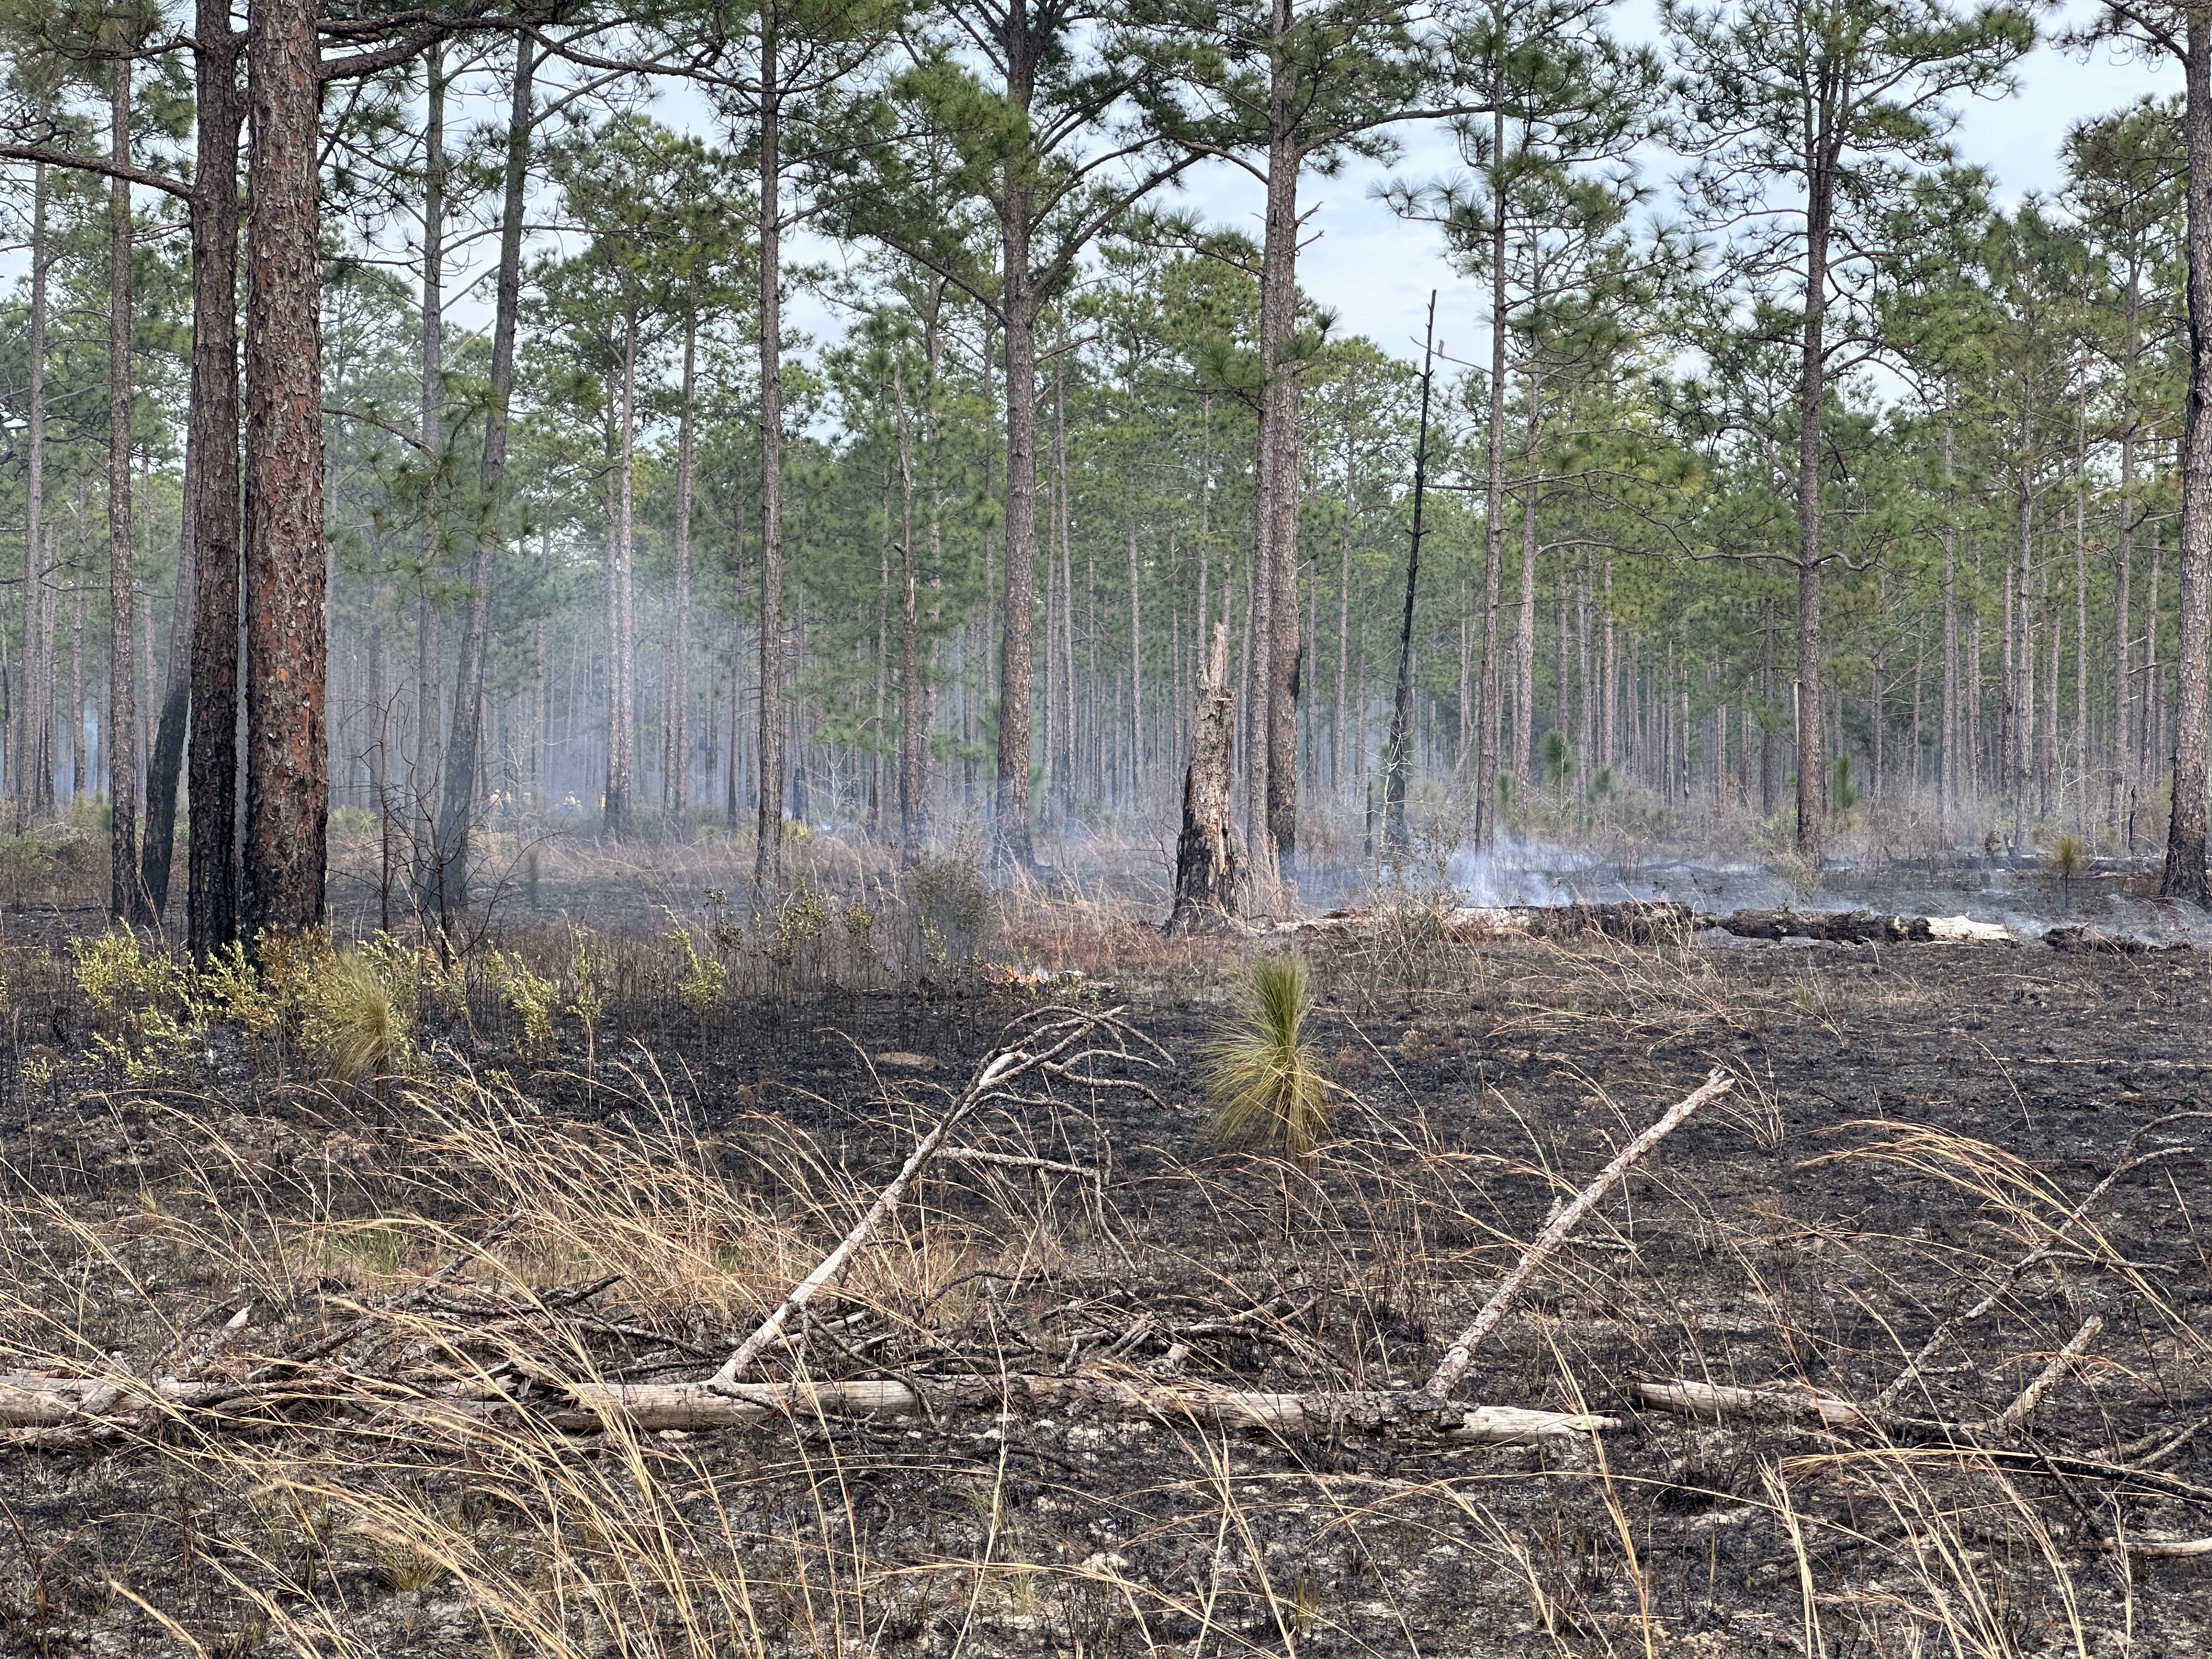
Some of the burn area a few hours after ingition. In the distance, researchers can be seen investigating fuels. |