
|
|
 |
||
|
CI Nowcasting Products Click product
headers below for detailed descriptions. IR Imagery and Band Differencing Temporal
Trends
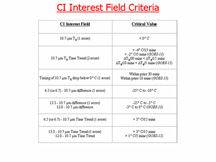
In order
to provide nowcasts of CI using IR satellite indicators, a scoring
system is developed that incorporates the interest fields described
above as a simple sum of positive indicators for the occurrence of
CI. It is important to restate that each IR-based CI interest field
used in the scoring is related to the physics of cloud growth and glaciation
related to precipitation formation in cumuliform clouds, and thus describes
the time-evolution of the CI process from an IR perspective. A summary
of the criteria incorporated into this scoring system is presented
in the table above, which justifies why eight of the possible 14 IR
information pieces from GOES are used; in essence, redundant information
exists across several of the IR interest fields. For the CI nowcasting
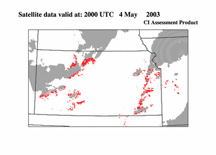
assessments, one point (score) is assigned to each pixel when a CI
interest field criterion is met. Satellite pixels that meet at least
7 of 8 CI criteria have been determined to represent rapidly growing,
immature (non-precipitating) cumulus in a pre-CI state. The underlying
assumption in this nowcasting system is that immature cumulus exhibiting
recent signs of rapid development will continue to evolve into precipitating
convective storms, provided that the cloud has access to sufficient
ABL/elevated moisture source. |
|||||||||||||||||||||||||
|
||||||||||||||||||||||||||
| Our Company | Products | Services | Careers | Contact Us |
| Copyright © 2005 CompanyName. All rights reserved. |