

|
|
 |
||
|
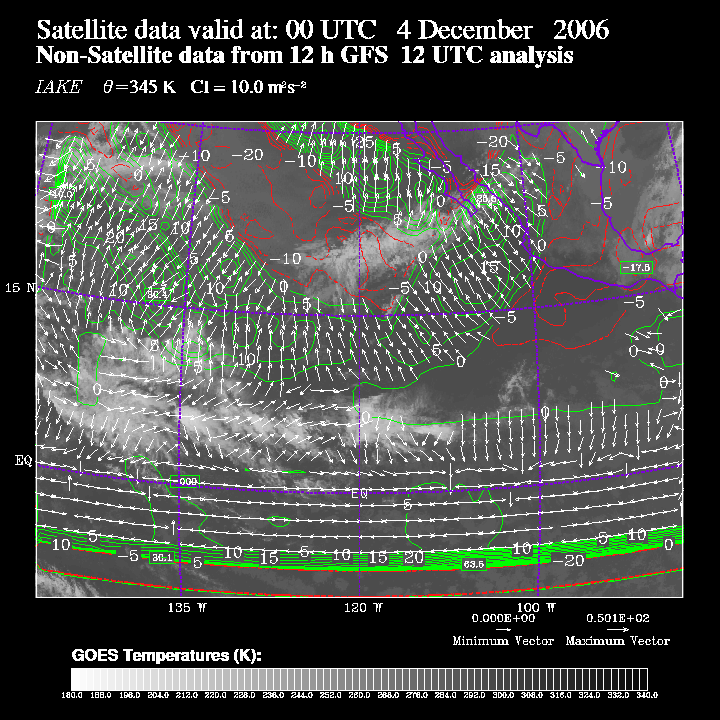
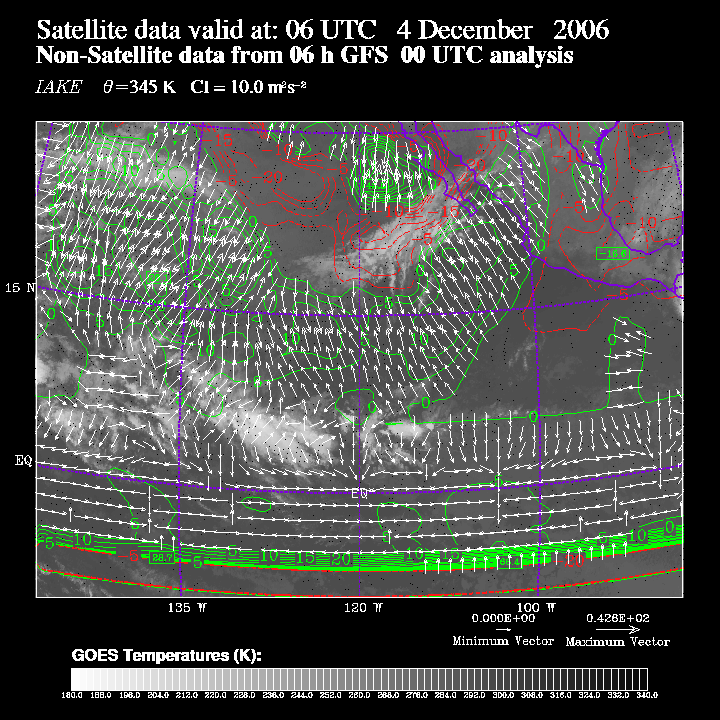
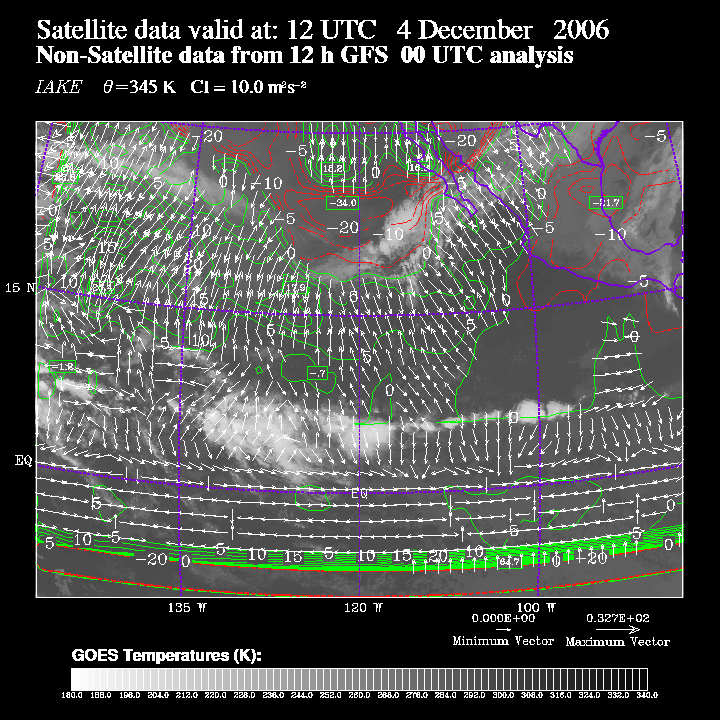
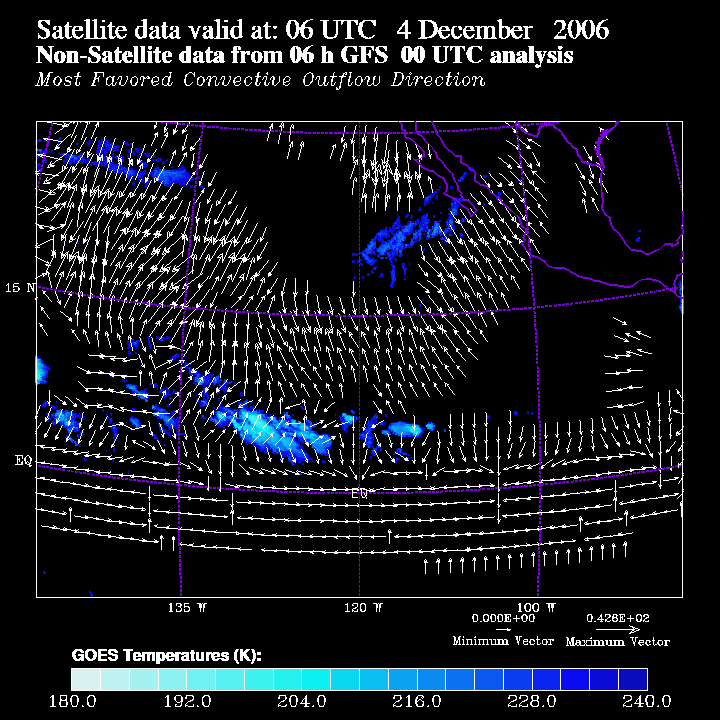
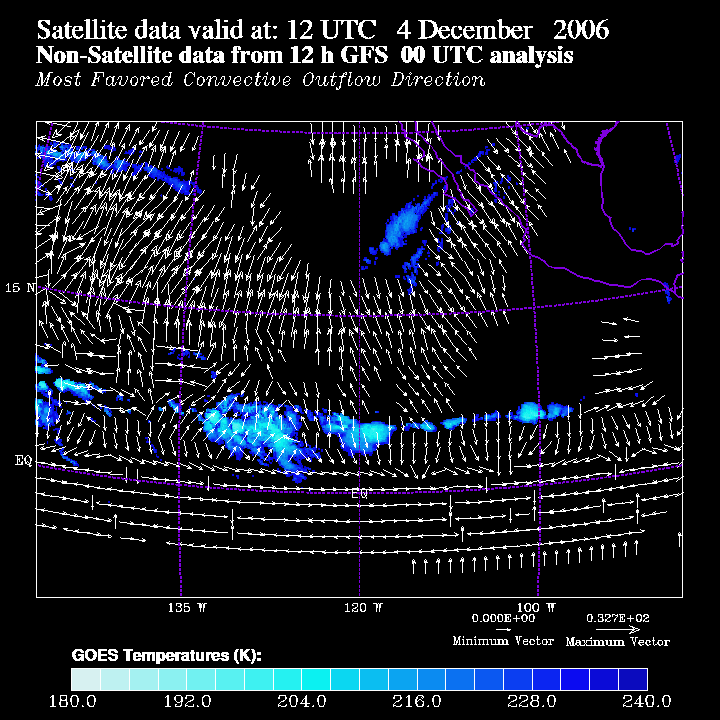
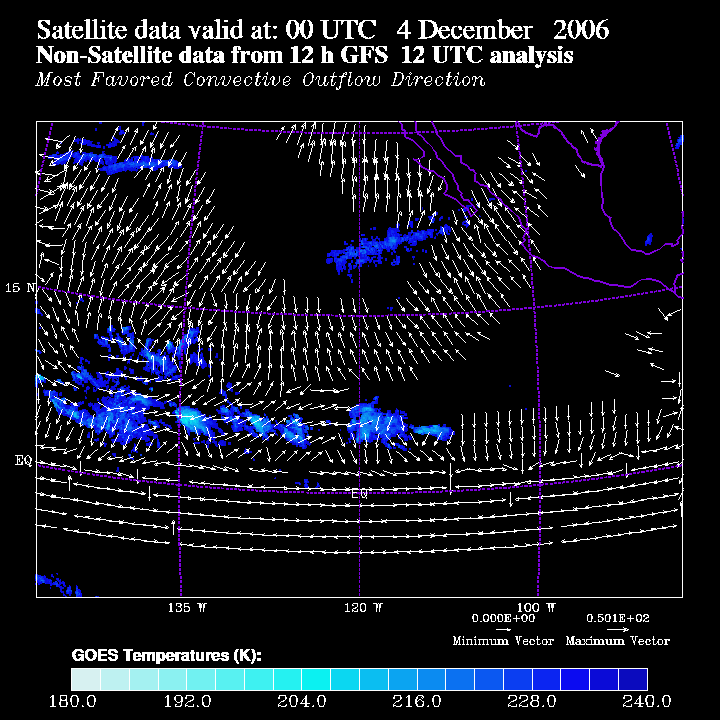
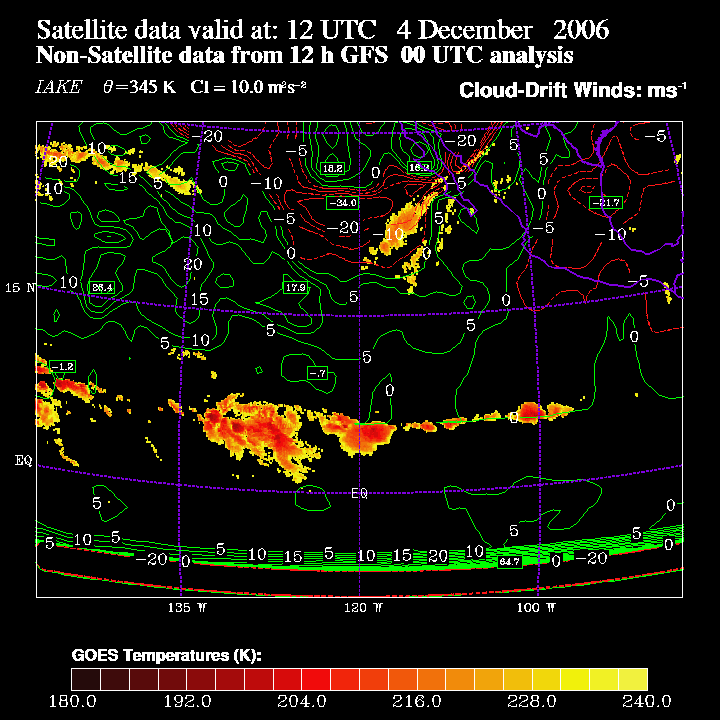
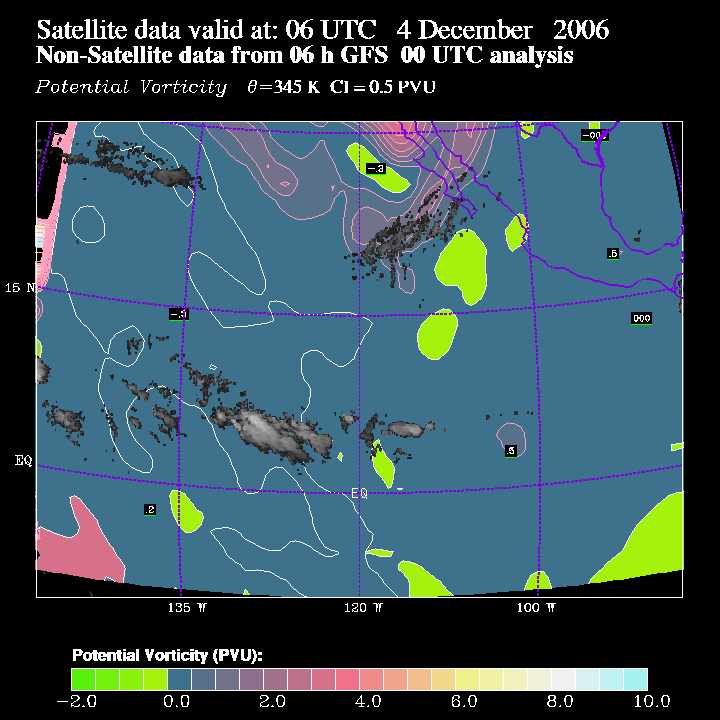
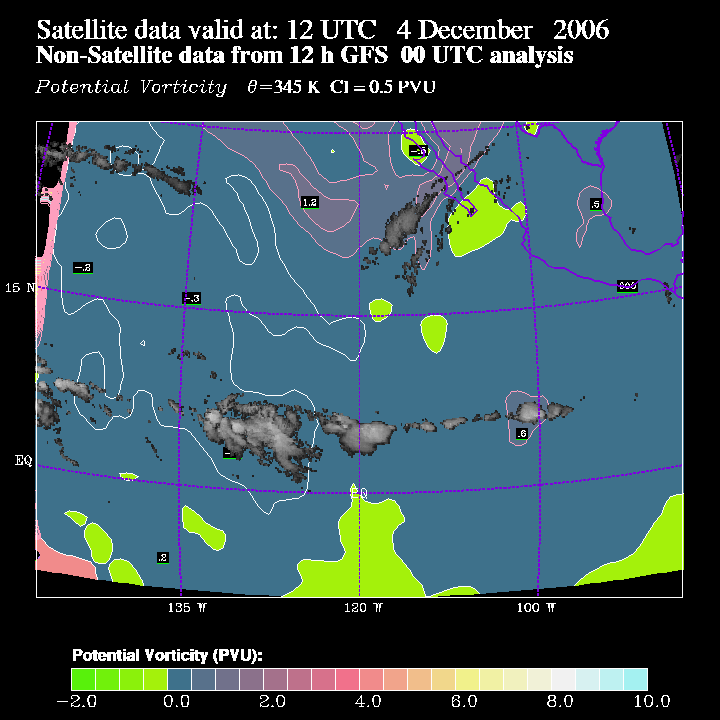
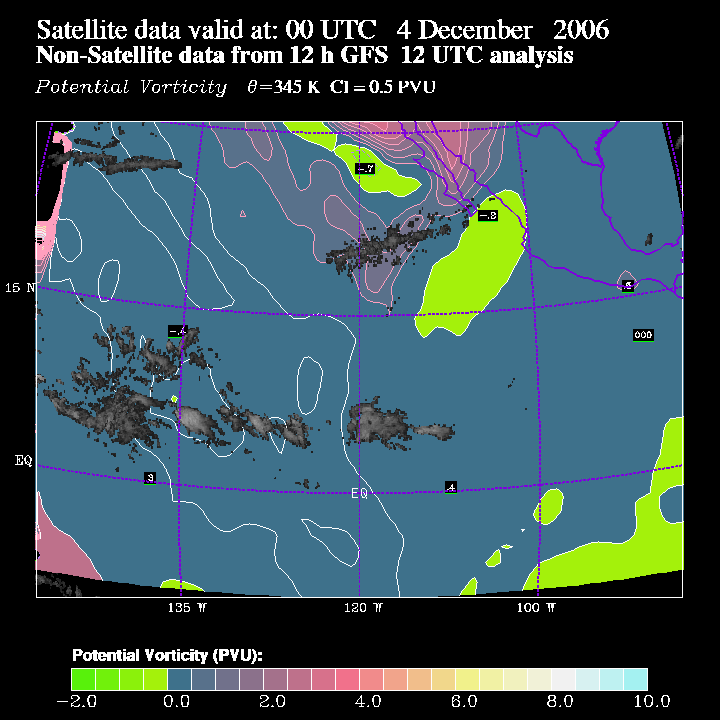
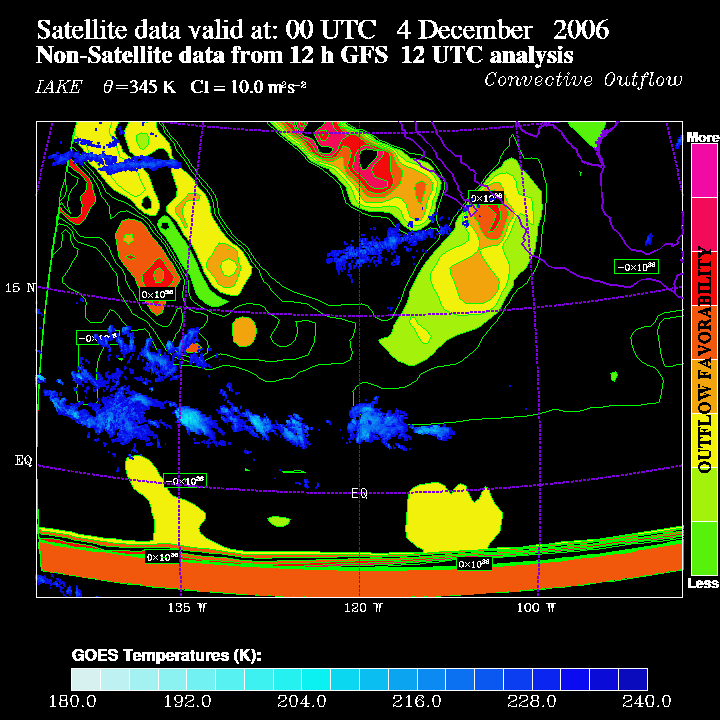
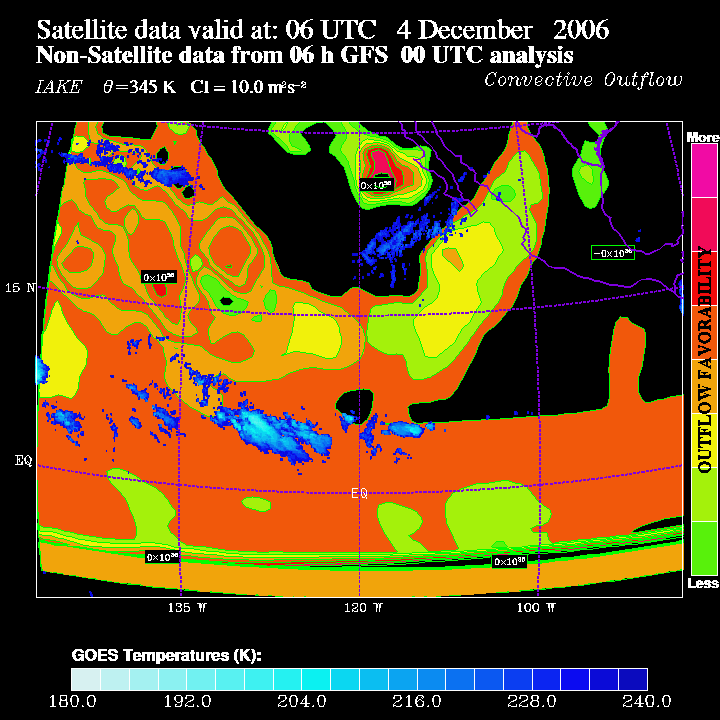
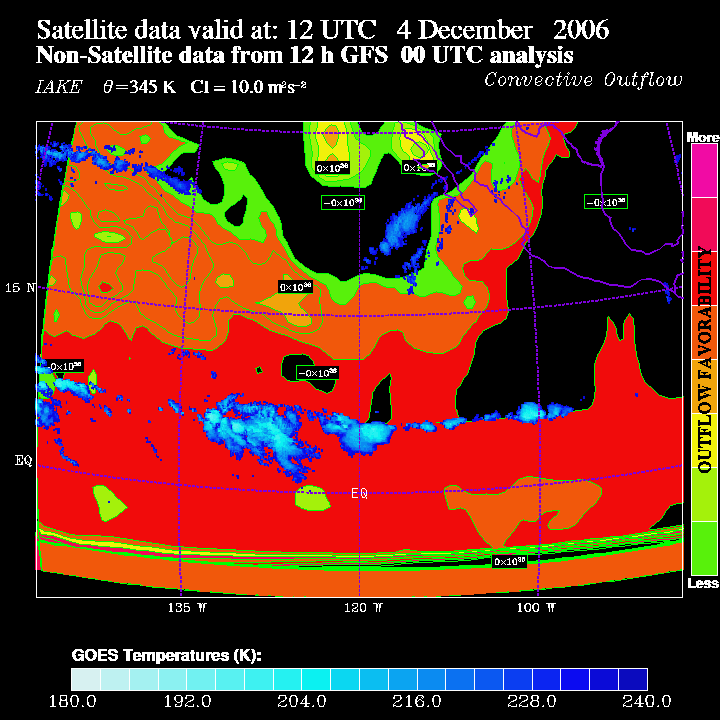
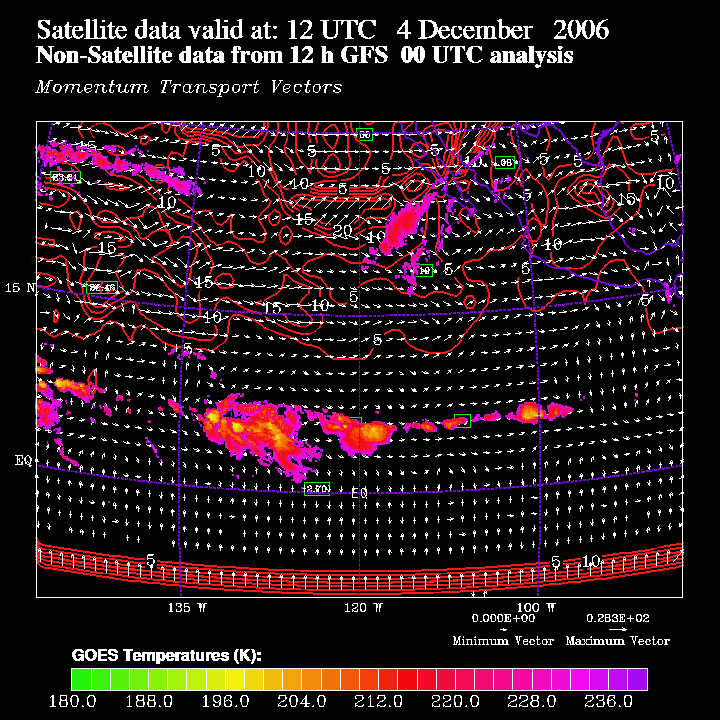
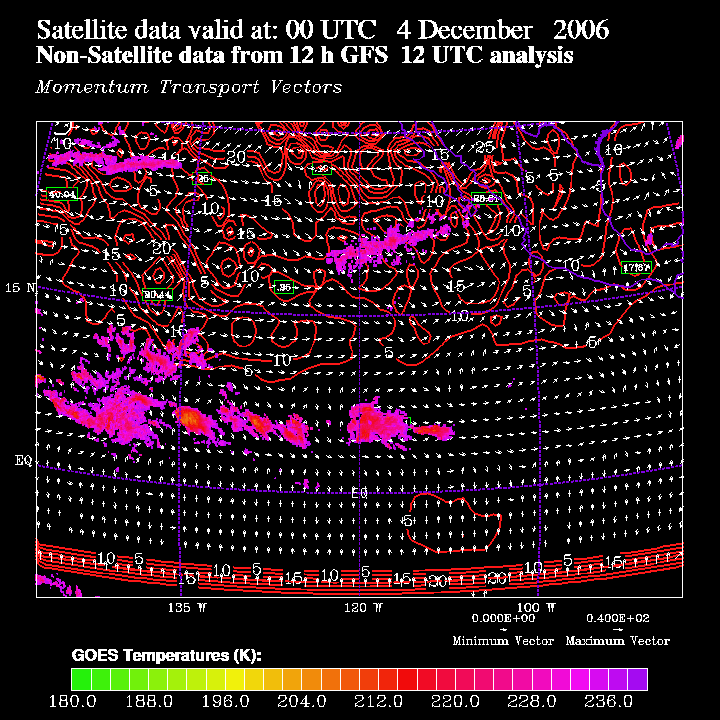
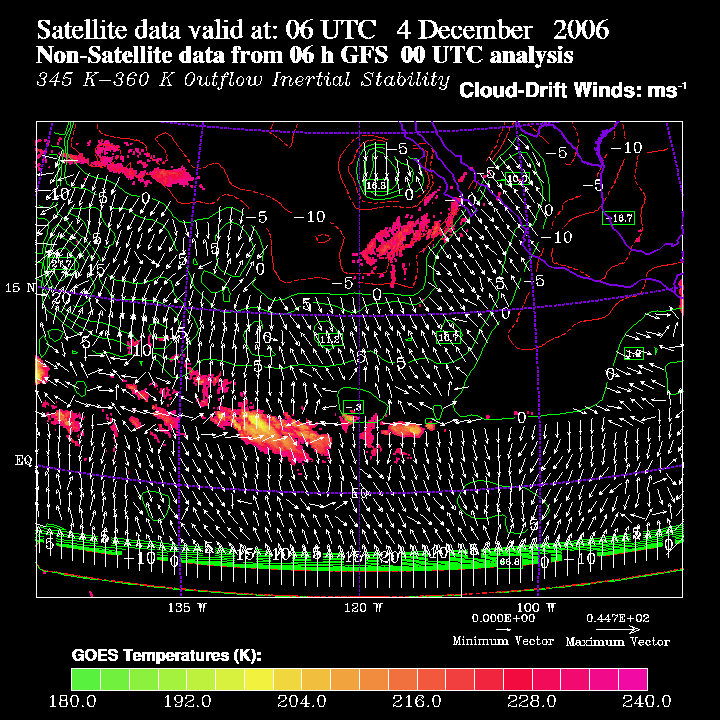
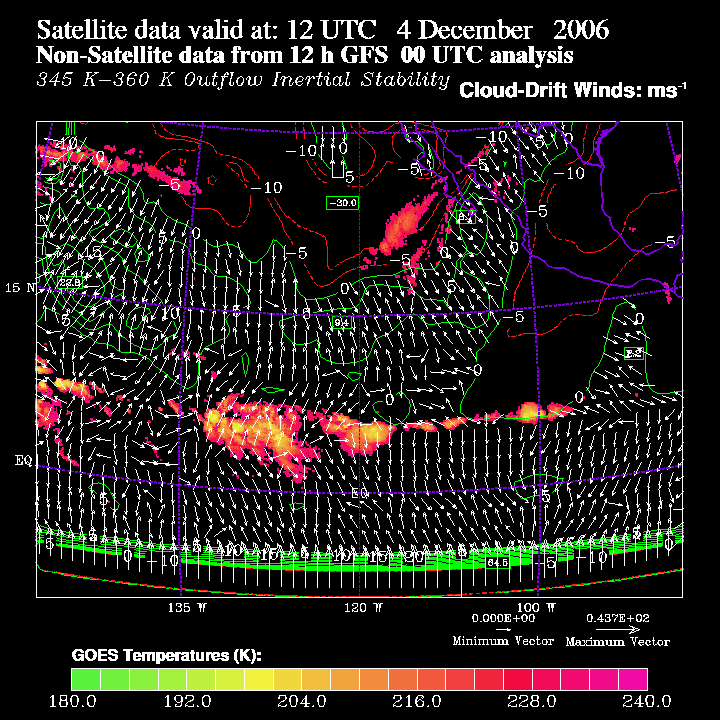
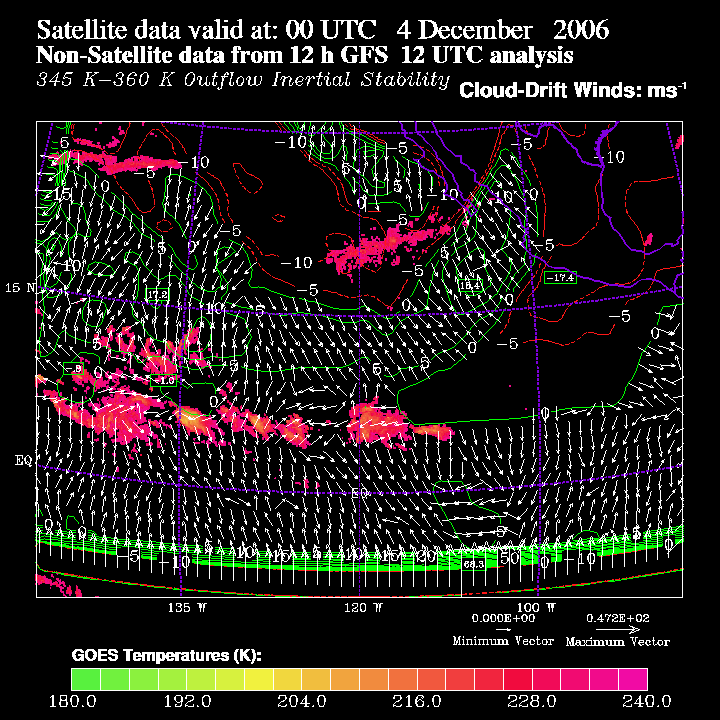
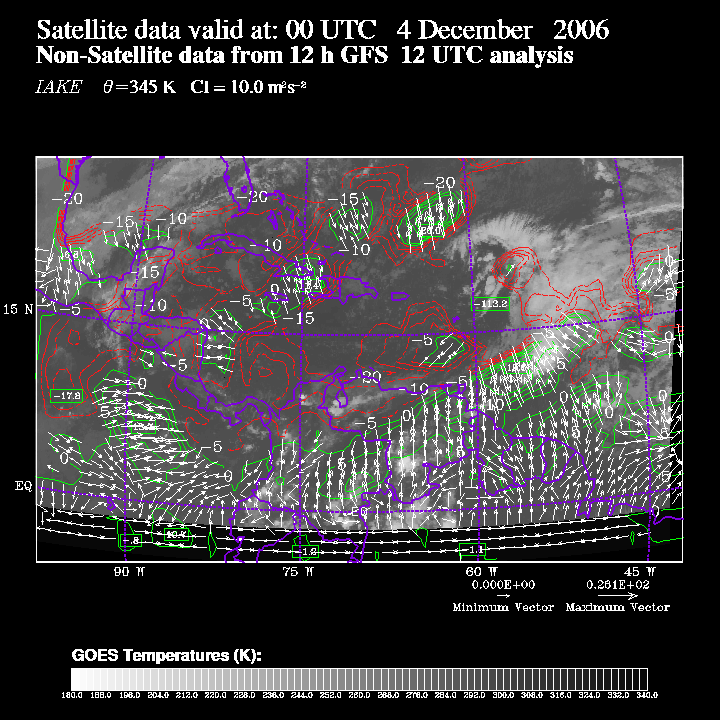
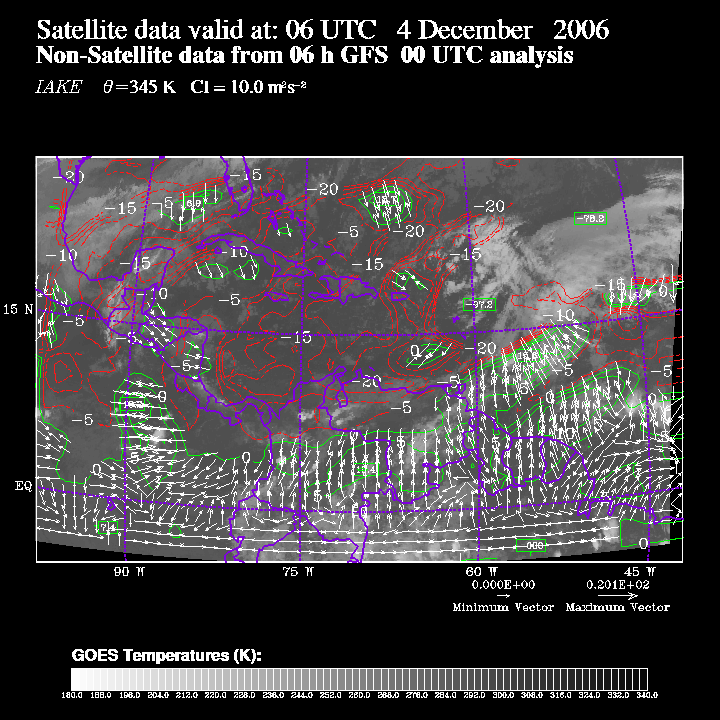
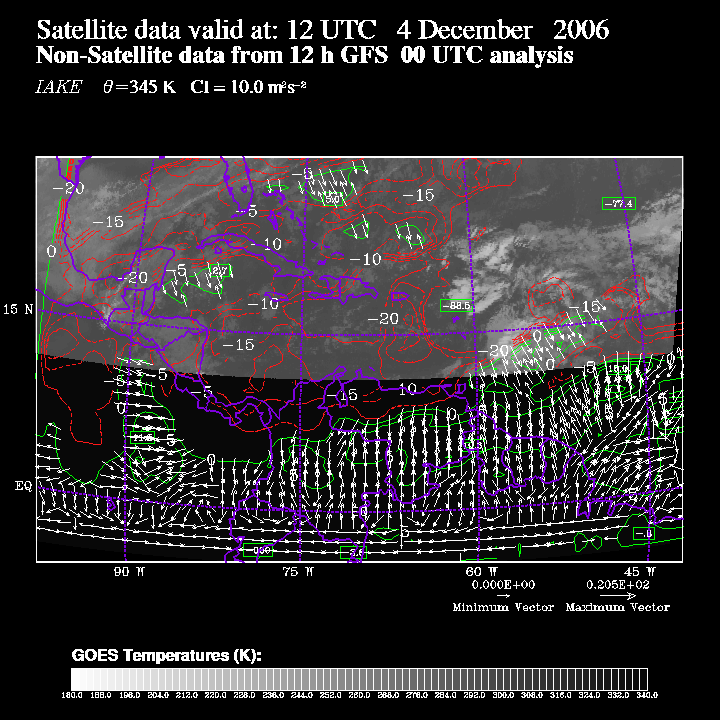
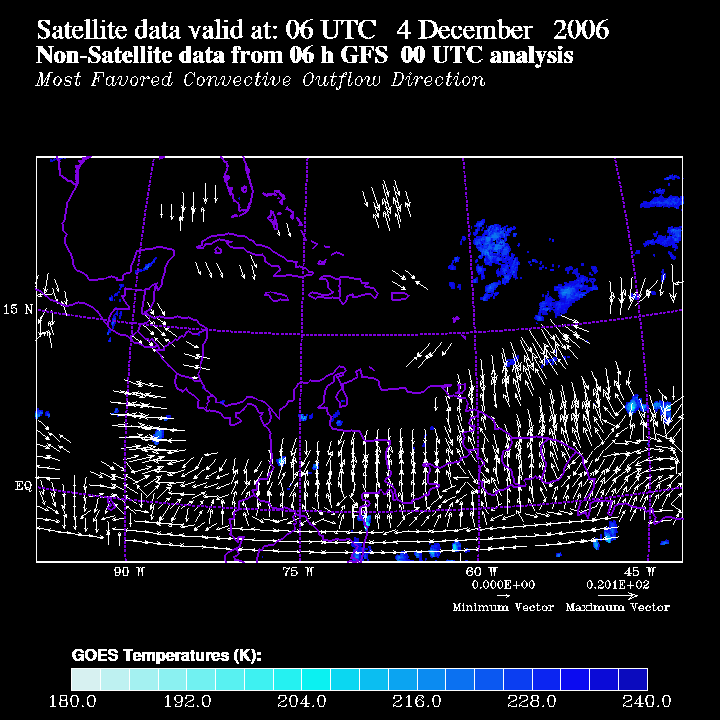
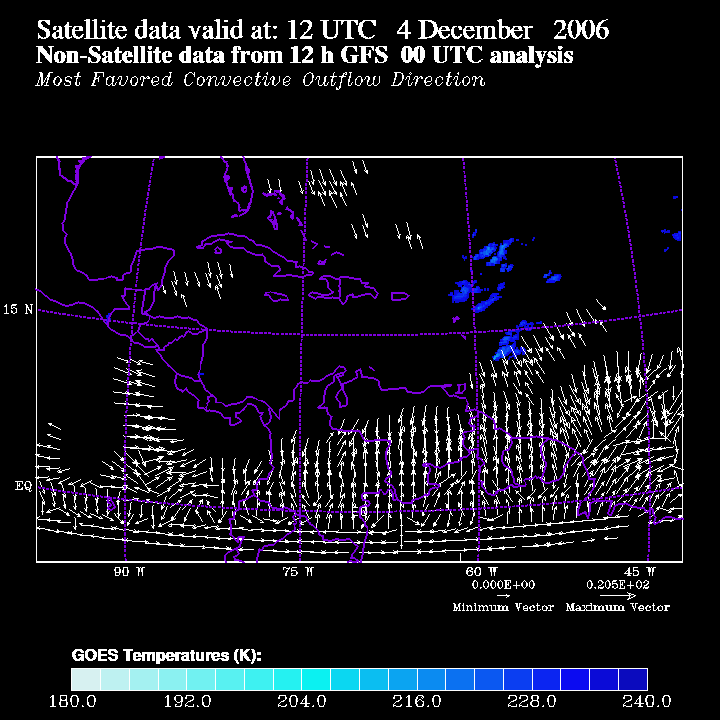
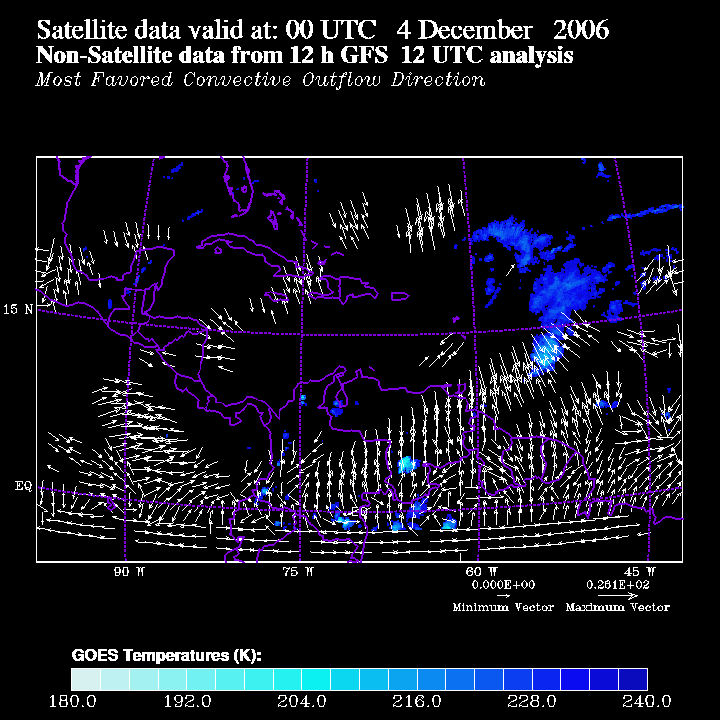
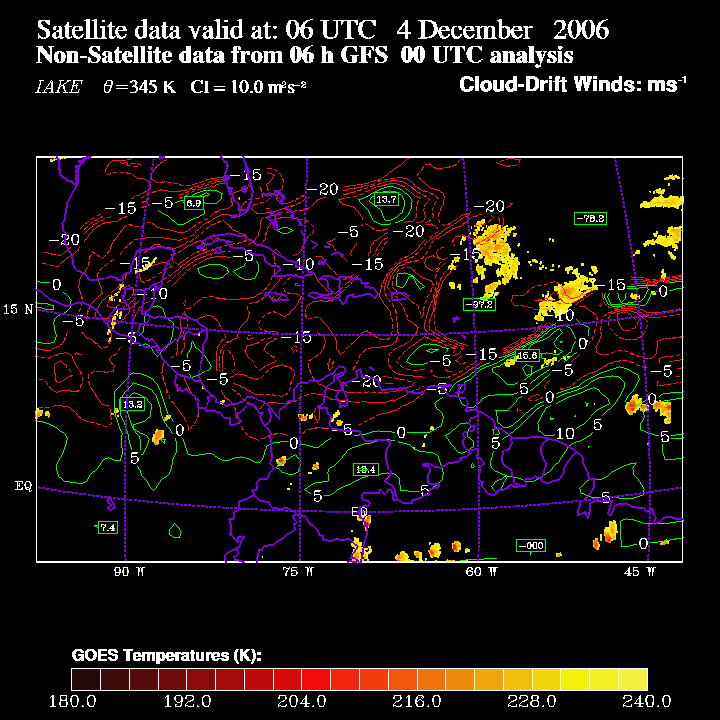
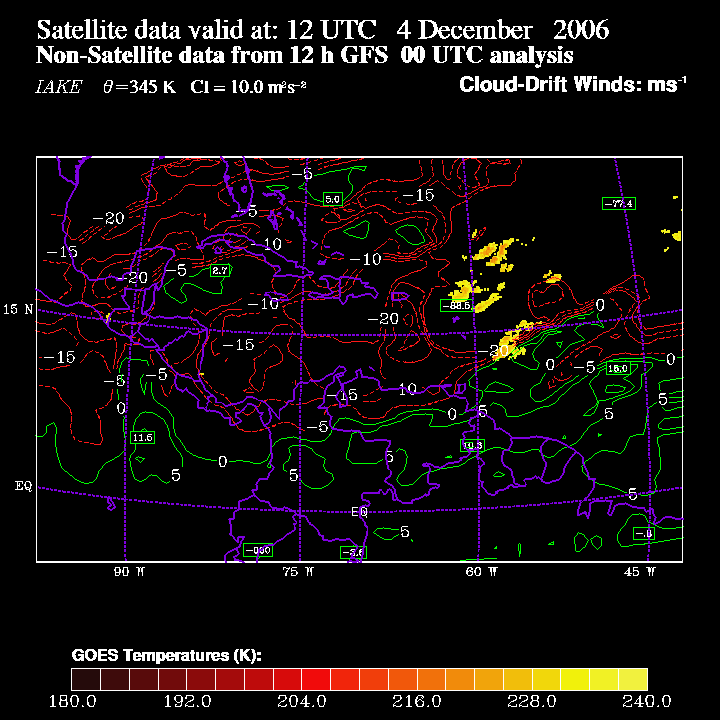
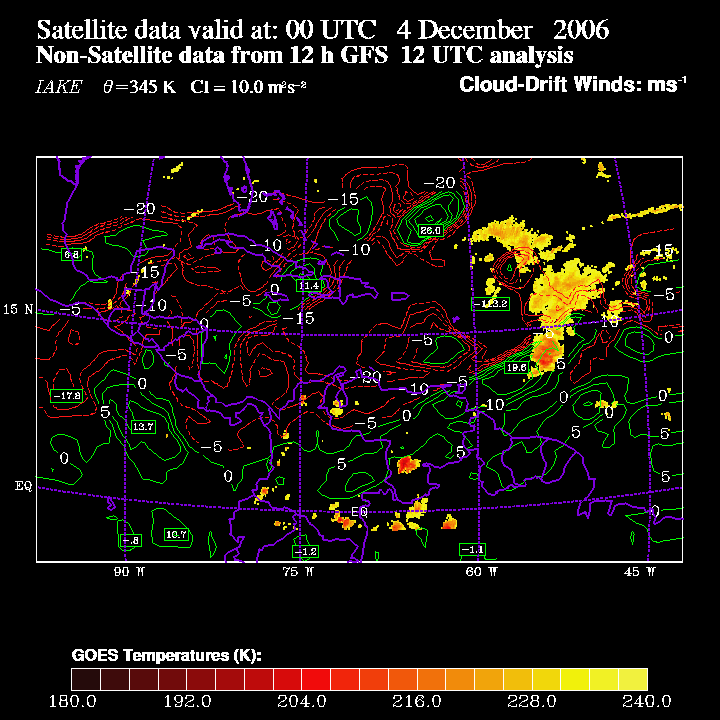
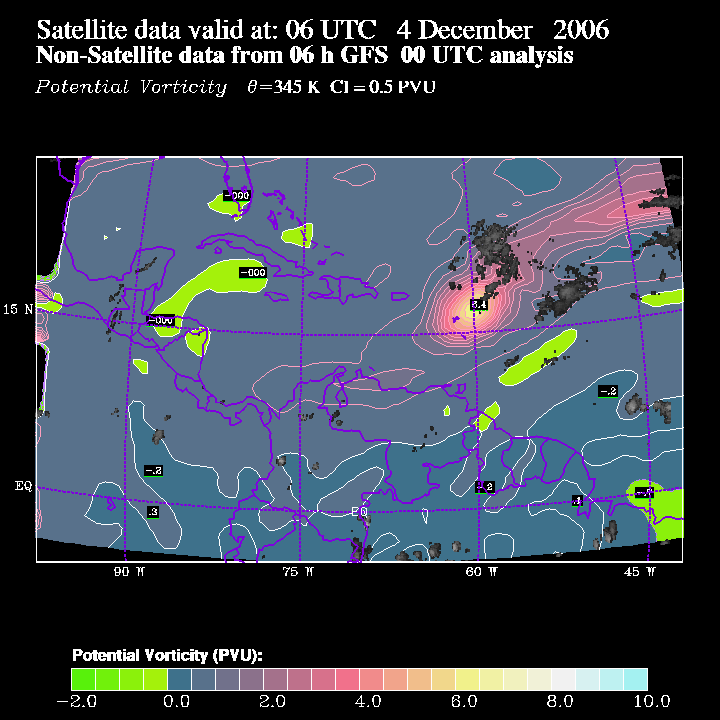
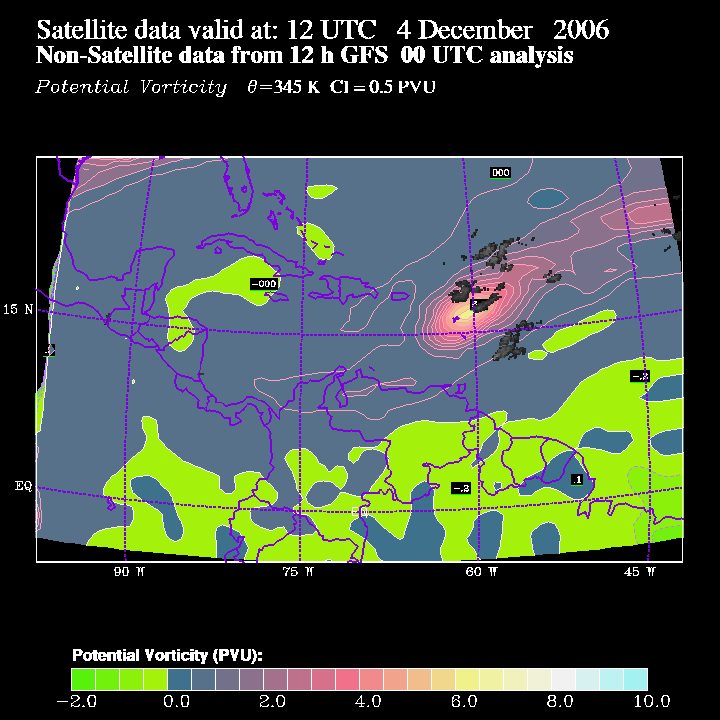
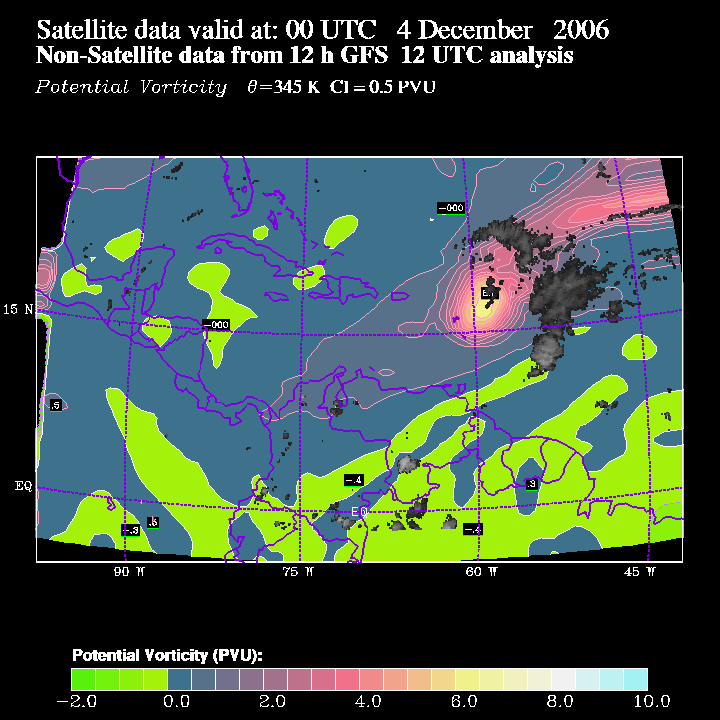
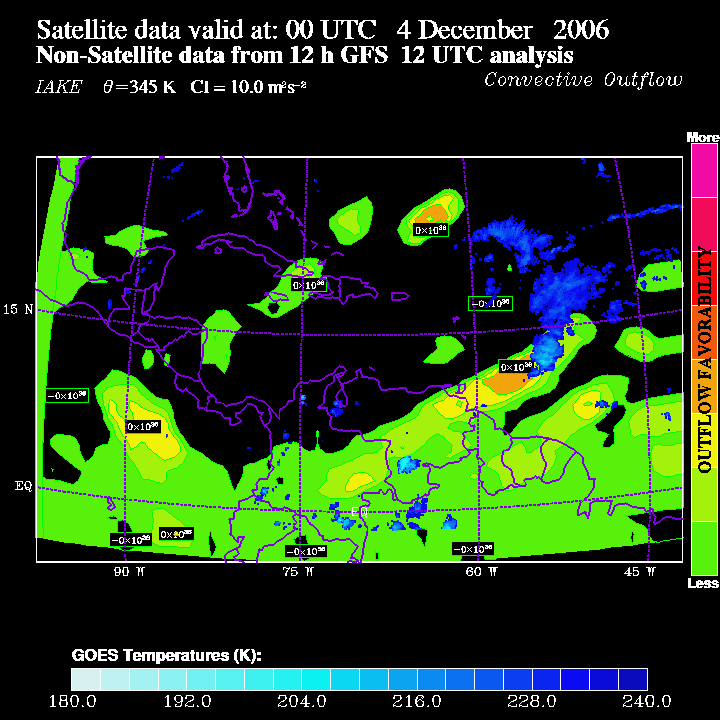
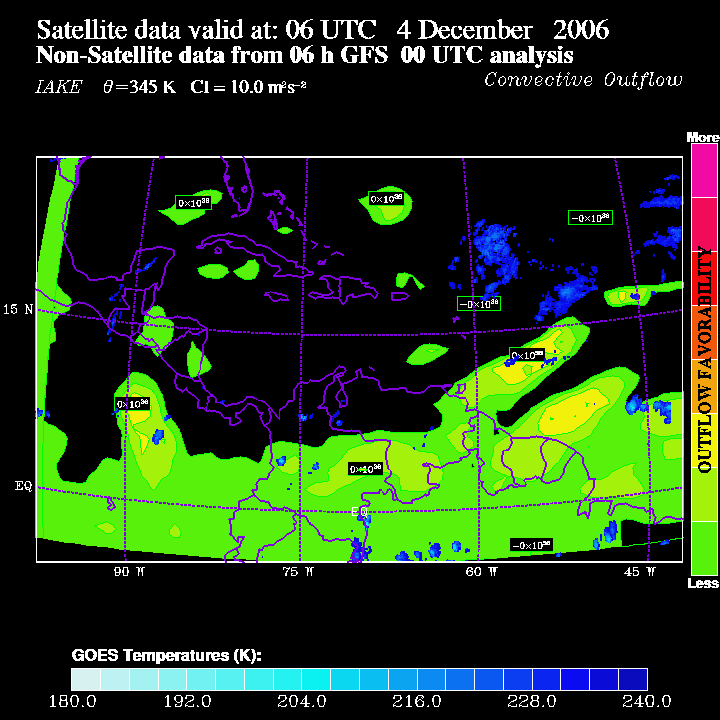
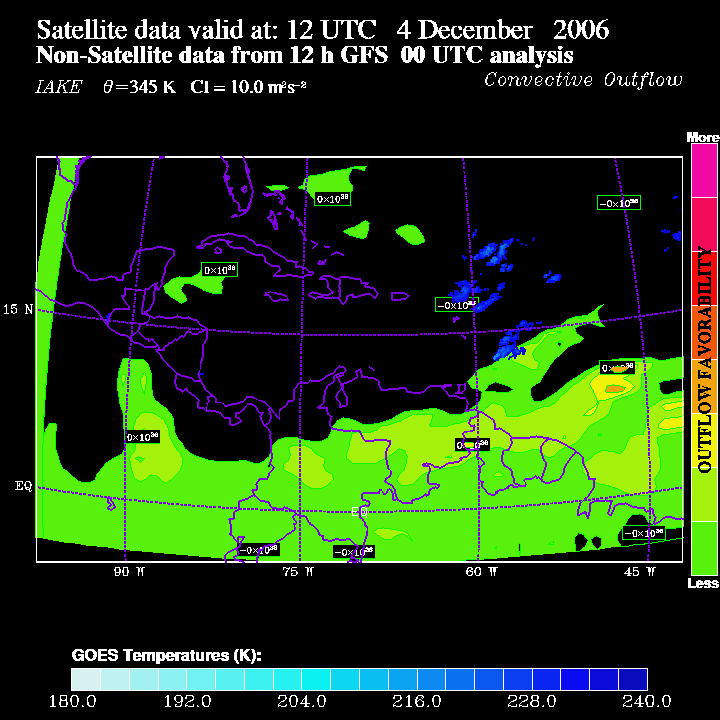
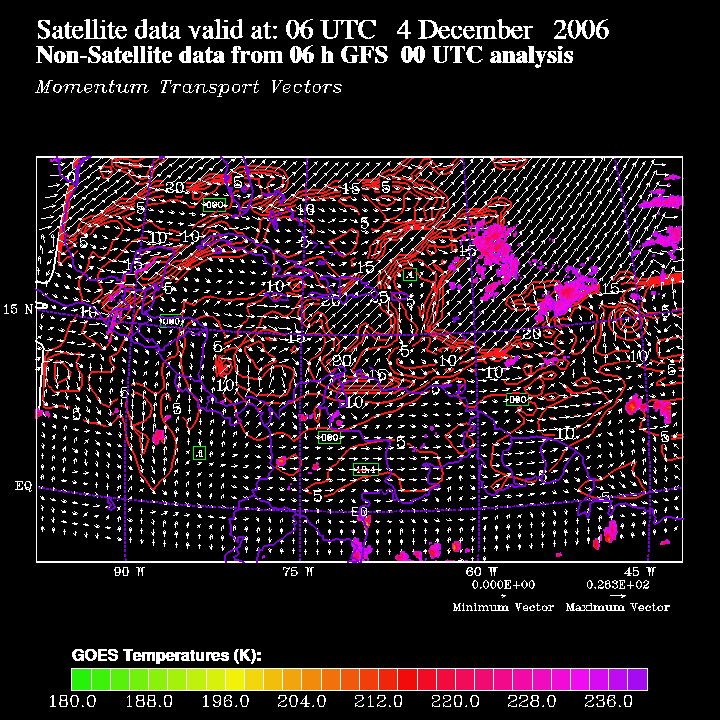
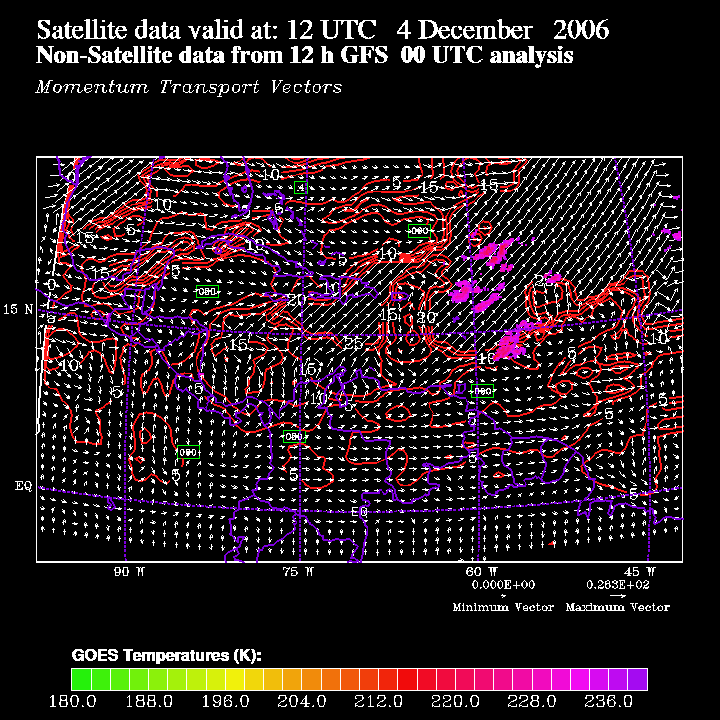
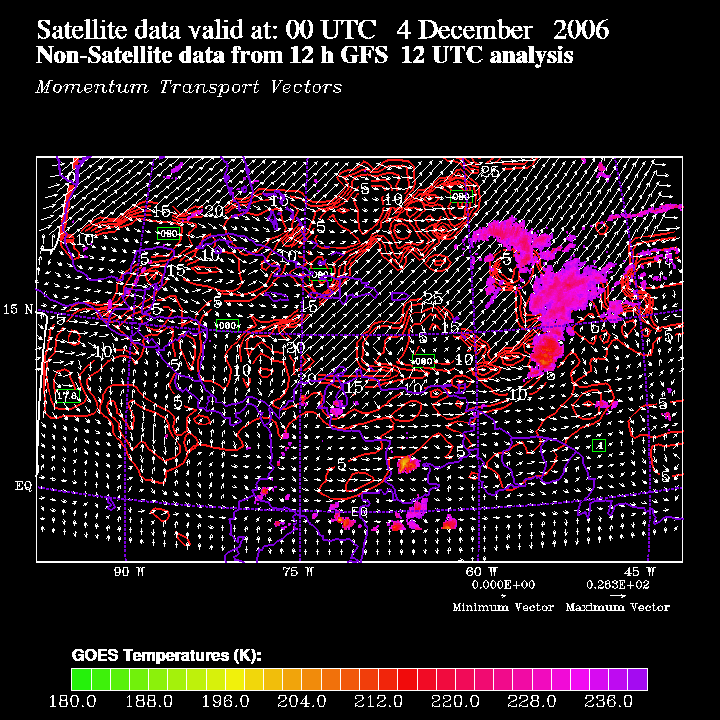
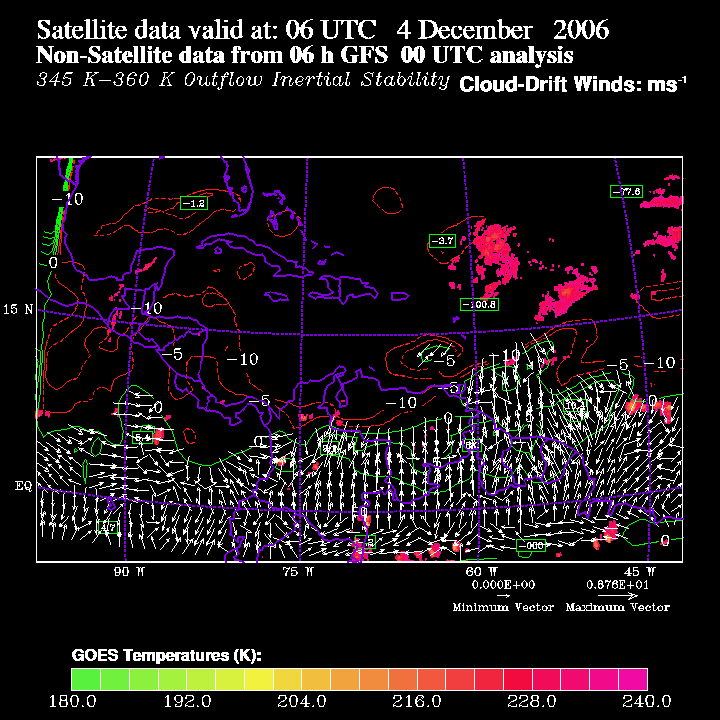
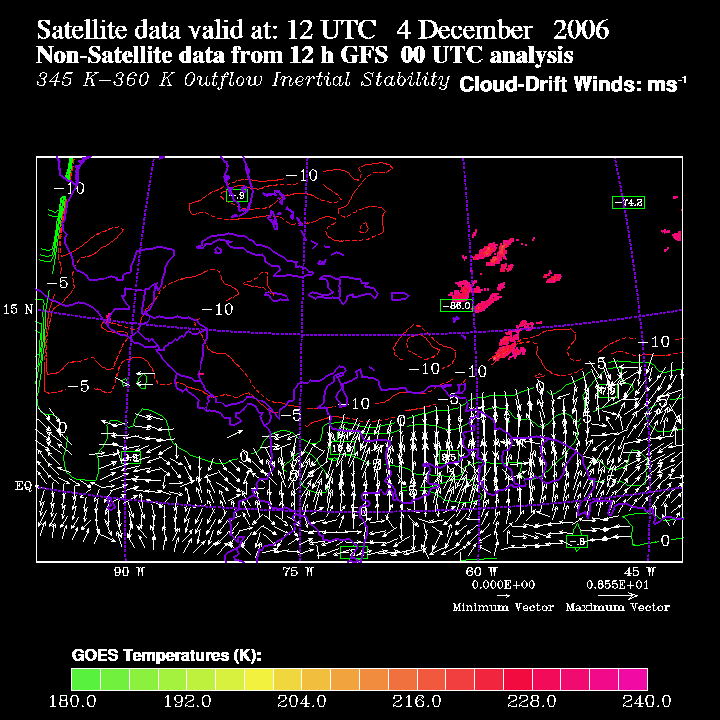
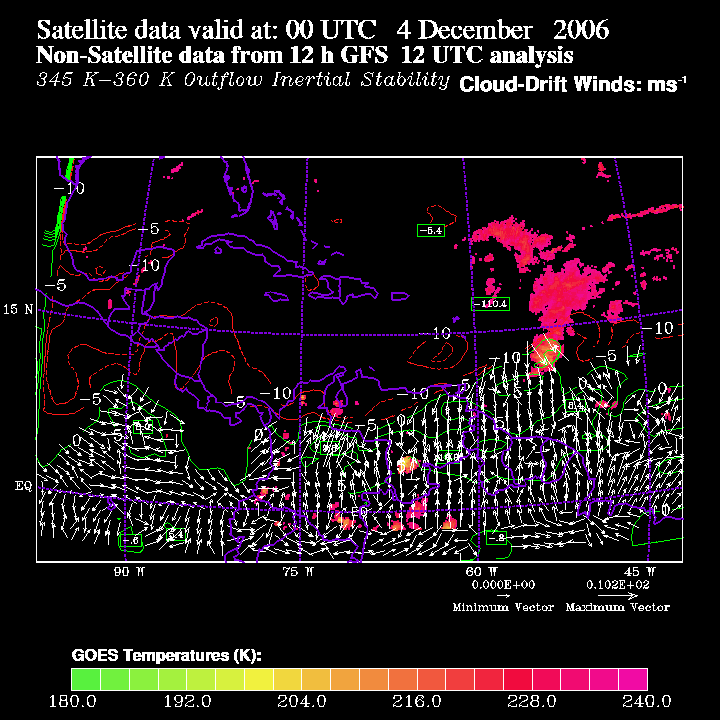
This page presents several products which combine upper tropospheric potential vorticity (PV), the integral of PV along a quasi-horizontal (isentropic) path as the quanitity Inertial Available Kinetic Energy (IAKE; see Mecikalski and Tripoli 1998), GOES-8 & -10 infrared and water vapor data, and GOES and Meteosat derived Cloud-Drift Winds (CDW) (Velden et al. 1997, 1998). The intent of these products is for the diagnosis of "outflow corridors" from active convection, convective systems and tropical storms. TCSP Main Page | Convective Outflow Diagnostic Products with Satellite Date | Upper Tropospheric Inertial Stablility Products | Written info Convective Outflow Diagnostic Products with Satellite Date
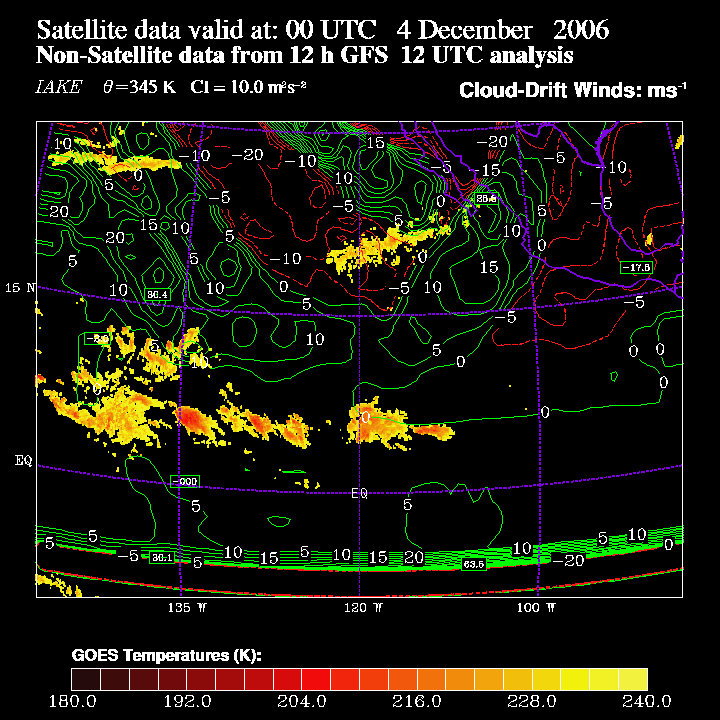
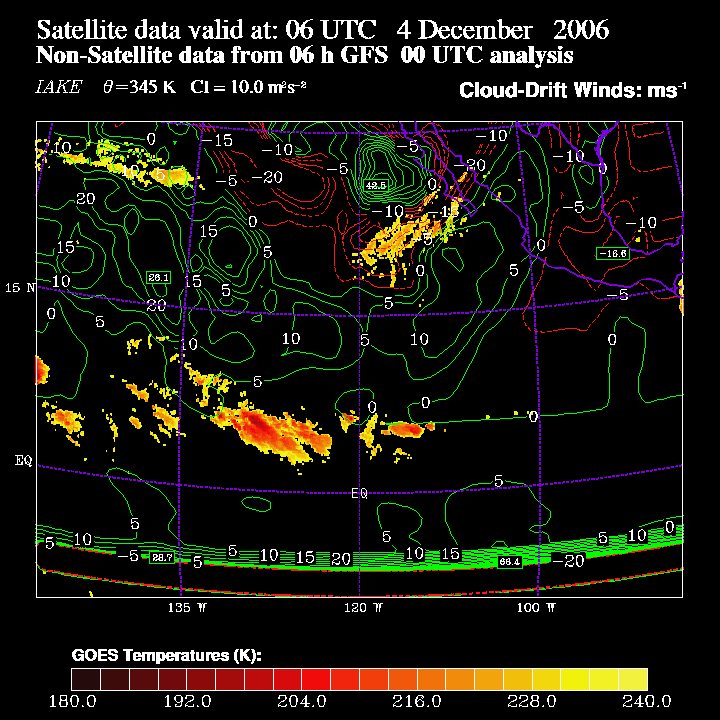
Upper
Tropospheric Inertial Stablility Products
back
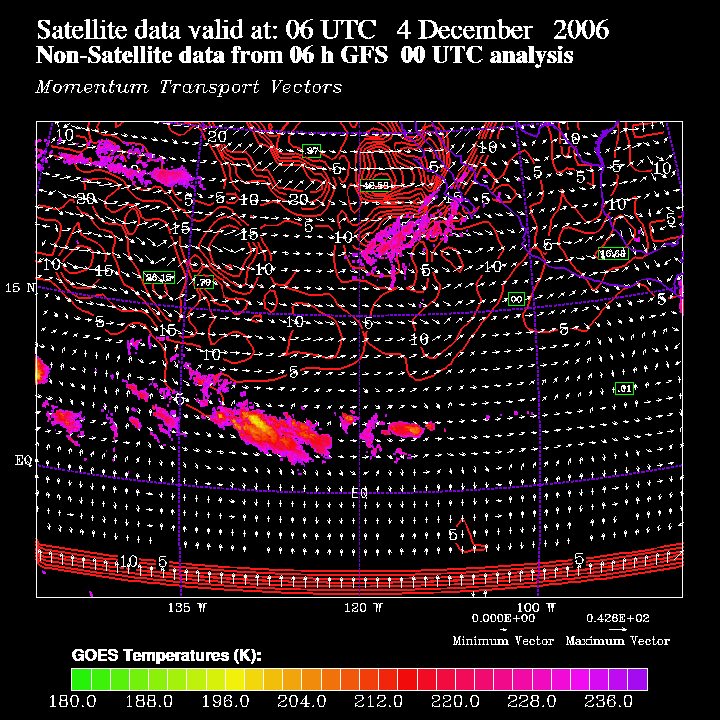
to top In the deep tropics where vertical wind shears are typically small, the IAKE and PV diagnostics are used to form a simple (first-order) approximation for convective momentum transport (CMT). The CMT products are likely correct for the sign of the transport but not the magnitude. The CMT-Inertial Stability relationships which form the basis of these products are described in Mecikalski and Tripoli (2001). Using the CDW information, several products are presented which are designed to assess whether upper tropospheric convective outflows are in fact correlated with low environmental PV, and how well can PV describe the future behavior of tropical storms and hurricanes. Products are made available for the current time period (00 hours), those which employ satellite data, and for forecast periods 06, 12, 18 and 24 hours. All fields are maintained online for five days; a more complete archive is available upon request. To facilitate tropical cyclone prediction with respect to North America, products for three large Oceanic basins are presented: the Eastern Pacific (to about 160 W), the Western Atlantic and Caribbean, and the Eastern Atlantic (to about 10 E). Meteosat-7 satellite data are used for the Eastern Atlantic domain. Data used to create the PV, IAKE and CMT information is from the National Center for Environmental Prediction's (NCEP) AVN 1 degree grid. All AVN-derived data are constructed on isentropic levels ranging from 340 to 360 K. The CDW data are kindly provided by C. Velden, T. Olander and D. Stettner of the Tropical Cyclone Research Group at the University of Wisconsin - Madison CIMSS. All data are plotted using NCAR Graphics. |
|||||||||||||||||||||||||||||||||||||||||||||||||||||||||||||||||||||||||||||||||||||||||||||||||||||||||||||||||||||||||||||||||||||||||||||||||||||||||||||||||||||||||||||
|
||||||||||||||||||||||||||||||||||||||||||||||||||||||||||||||||||||||||||||||||||||||||||||||||||||||||||||||||||||||||||||||||||||||||||||||||||||||||||||||||||||||||||||||
| Our Company | Products | Services | Careers | Contact Us |
| Copyright © 2005 CompanyName. All rights reserved. |
