Ozone Collar
Recovery
Yang
E.-S., D. M. Cunnold, M. J. Newchurch, R. J. Salawitch (2005),
Change in ozone trends at southern high latitudes, Geophys. Res.
Lett., 32, L12812, doi:10.1029/2004GL022296. Full
Text
This publication uses ground-based as
well as satellite-based measurements to verify the recovery of the ozone
hole at the southern high latitudes (60°-70° S). Four
different data sets are considered in this study (Dobson Spectrophotometer
measurements, ozonesonde measurements, SAGE II and HALOE stratospheric
ozone profiles, and TOMS measurements between 1979-1984 from Nimbus 7). All
data sets agree that ozone is recovering in the southern high latitudes.
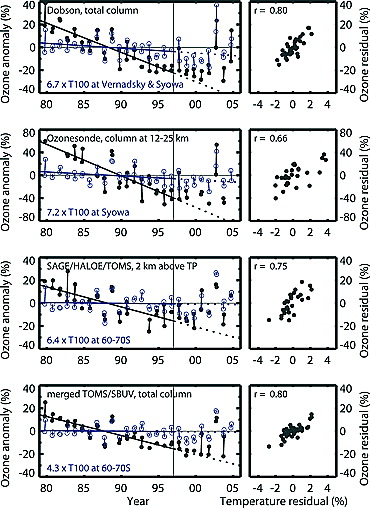
Figure 1. Monthly mean ozone
(black filled circles) and ozone equivalent temperature (blue open
circles) anomalies for Septembers and Octobers (left) and scatterplots
of ozone residuals against temperature residuals at 100 hPa for 1979–1996
(right) for the Vernadsky (65.2°S) and Syowa (69.0°S) Dobson
total ozone columns (averaged, first panels), ozonesonde ozone columns
from 12–25 km for Syowa (second panels), SAGE/HALOE(/TOMS) stratospheric
ozone columns at 60–70°S (third panels), and merged TOMS/SBUV
total ozone columns at 60–70°S (fourth panels). The ozone
and temperature residuals plotted for 1979–1996 result from subtracting
the 1979–1996 trend line from their anomalies. The ozone equivalent
temperature anomalies are the temperature anomalies after multiplication
by 6.7, 7.2, 6.4, and 4.3 respectively for each data source. They represent
the ozone variations attributable to the temperature perturbations.
Temperature dependence of ozone reactions
in the southern high latitudes is illustrated in the above figure. Temperature-ozone
correlations are consistent with a direct relationship between September
temperatures and the September ozone amounts.
|