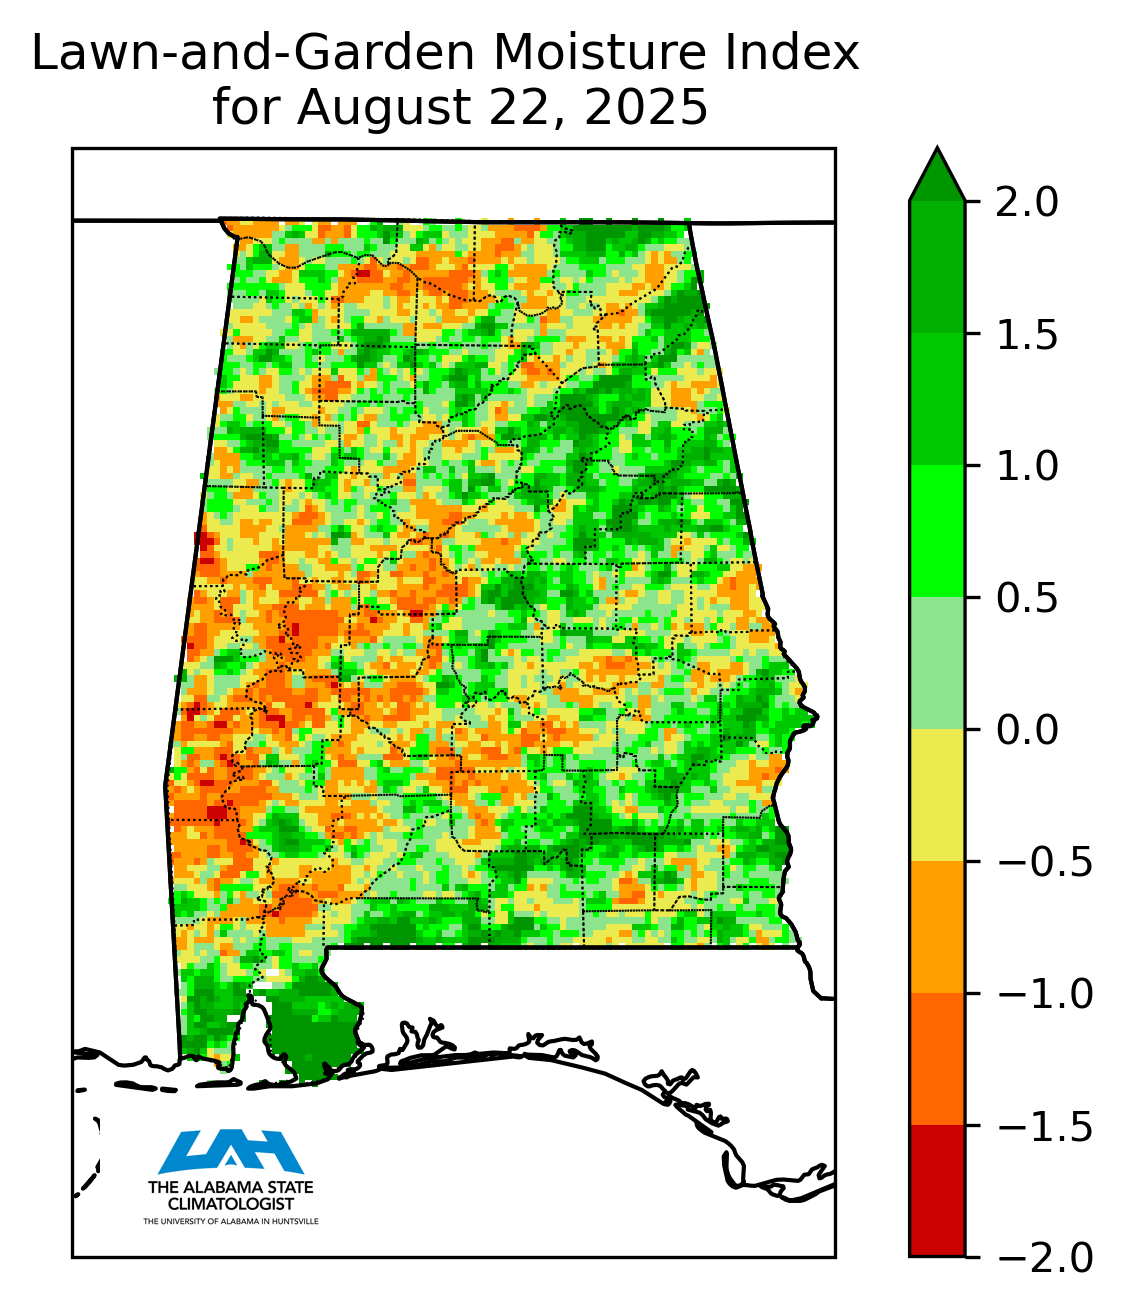
The Most Recent Lawn/Garden Moisture Index for the State of Alabama
Explanation of Moisture Index
The
lawn-and-garden moisture index measures the capacity of current
soil moisture to sustain healthy lawns and gardens. The index is
computed in two stages.
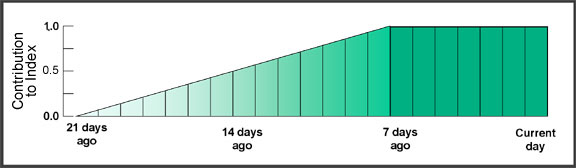
First, we estimate how much recent precipitation
contributes to current soil moisture. We assume that any precipitation
over the past 21 days should be included in the computation. We also
assume that more recent precipitation is more significant than the
less recent. We consider all precipitation during the previous 7-day
period to be equally important, but precipitation before that time
is discounted according the sliding scale shown in Diagram 1. The result
is the total effective precipitation during the period.
Diagram 1.The sliding
scale used to determine the contribution
of recent precipitation to the lawn-and-garden
moisture index.
If
precipitation fell uniformly through a
21-day period such that the total for the
period were 3 inches, then the total effective
precipitation would be 2 inches. The precipitation
we use to compute the index is obtained
from NOAA's Climate Prediction Center.
It is determined from weather radar images
in conjunction with precipitation reported
at rain gages.
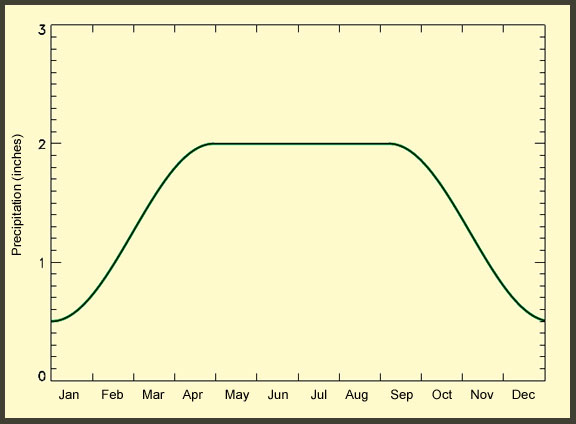
Second,
we find out how much the total effective
rainfall for the current day differs from
a "standard" amount of rainfall
considered to be adequate for that time
of year to sustain healthy lawns and gardens.
The difference is the lawn-and-garden moisture
index. Of course, much less precipitation
is needed during the cold months than in
the warm ones. The curve in Diagram 2 shows
the standard amount we assumed throughout
the year. In the coldest time of the year,
about 1/2 inch is considered to be enough;
in the hottest, 2 inches. If the total
effective precipitation on January 1 were
1 inch, then the index would be +1/2 inch
for that day, but the same amount on July
1 would give an index of -1/2 inch. Thus,
positive values of the index indicate adequate
precipitation or better. Negative values
indicate a precipitation deficit.
Diagram 2.The curve
used to estimate the standard amount of precipitation
is considered to be adequate to sustain healthy
lawns and gardens.
The
curve shown in Diagram 2 does not work
equally well for every part of the State.
In parts of the State the soil is loose
and drains rapidly. In other parts, the
soil has the ability to retain moisture
for longer periods of time. Also, different
grasses, shrubs, flowers, and garden crops
have differing moisture requirements. However,
the curve is good enough to provide a general
idea of the parts of the State receiving
enough precipitation to have attractive
lawns and productive gardens and those
that are not.