 |
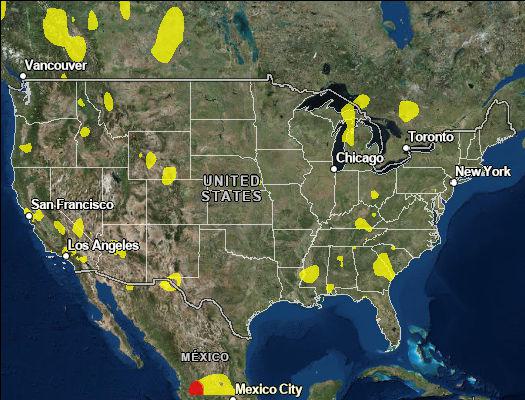
AIRNow Home Current national AQI Animation, AQI Peak, Ozone Peak, & Particles Peak. |
|
 |
Air Quality Archive Maps Archive data available by chosing region and date to display AQI Animation, AQI Peak, Ozone Peak, & Particles Peak. Maps are from January 2011 to the present. |
|
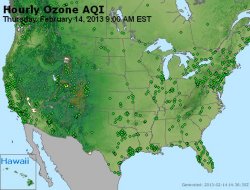 |
Air Quality Monitor Maps The dots on this map represent the current hour's air quality index at individual monitoring stations. The stations shown have been approved for public reporting on AIRNow by the state, local or tribal agency responsible for the monitor's operation. |
|
| U. S. Air Quality Summary |
An alphabetical state-by-state listing of cities with current and forecast AQI values. A link to archived data is provided as well. |