
Volume 3, Number 15, December 2012
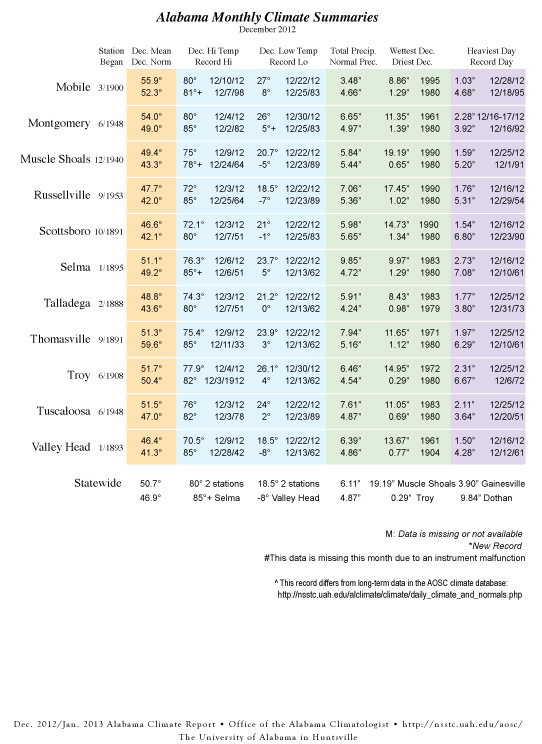
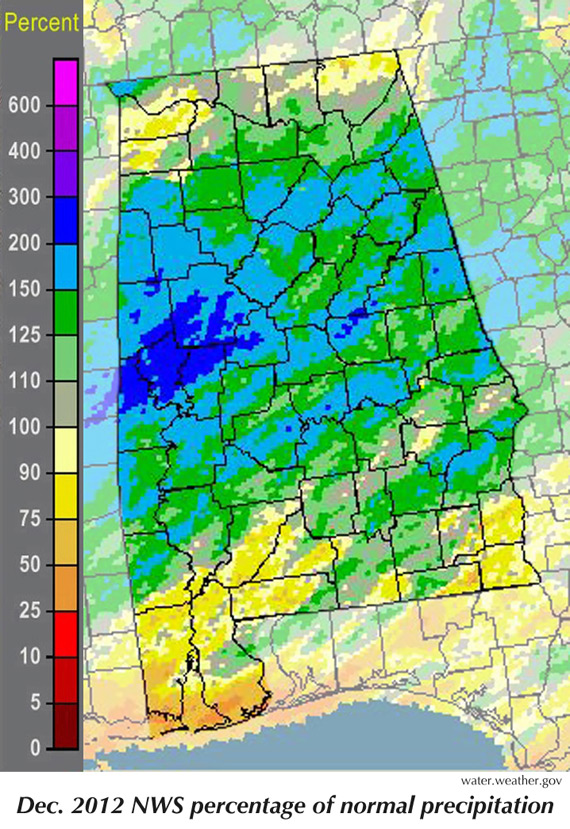
December in Alabama was warm and wet, so warm that it moved 2012 into the top ten warmest years in the 1890 to 2012 climate record. In our sample of 26 Alabama cities, December was almost 4° F warmer than normal. Haleyville had its warmest December day in that station's 69-year history — 81° on Dec. 16.
Of course, measuring temperatures over an area the size of Alabama is more complicated than it might appear at first glance. Even if you don't get into the complicated math, with margins of error and so forth, just saying what the average temperature was over a large area isn't necessarily a straightforward proposition.
We frequently use climate data gathered, processed and adjusted by NOAA's National Climatic Data Center in North Carolina. This is a very useful dataset, but NCDC hasn't found an accurate way to remove problems like urban warming.
We sometimes refer to urban warming as the asphalt effect, since asphalt and similar materials are significantly to blame for the artificial warming we see around most cities (also called the urban heat island). This warming can even affect a rural station if a new building or parking lot happens to be built close enough.
Unlike trees, grasslands, and even some deserts, asphalt and paving materials are efficient at absorbing energy from the Sun and converting it into heat. That's the main reason parking lots, highways, rooftops and airport runways can be so much hotter than the surrounding lawns, fields and forests. That extra heat warms the air near the ground, raising temperatures recorded by National Weather Service thermometers (especially at night).
We all live near the ground, for the most part, so the NCDC temperature data is quite valid for telling us how hot or cold it was down here on the surface.
If we want to keep track of the climate, however, and things that we might be doing to change the much larger atmosphere, we should probably try to subtract the effects of paving and construction. While they do change temperatures on the ground, those effects are so shallow and weak that they don't even show up in the satellite-based instruments my colleagues and I use to keep up with global climate changes.
To look at Alabama's climate history in an apples-to-apples way, I looked at only the state's rural thermometers. These instruments are all in areas where there are less than 50 people in a 9-square-kilometer area (roughly 3.24 square miles or a square 1.8 miles on a side). And I came up with two sets of numbers.
The first set just looks at daily high temperatures (TMax). This is useful for keeping track of the climate in the deep atmosphere above the surface because heat rising from the surface during the day mixes the layers of the atmosphere and pulls cooler air down to the surface. That means the TMax gives us a sample not just of air near the ground but also of air that was recently aloft.
If we look at the TMax, then 2012 was the state's eighth warmest year.
TMax |
|
1921 |
3.35° F |
1911 |
2.92° F |
1990 |
2.9° F |
1927 |
2.81° F |
1925 |
2.7° F |
1954 |
2.7° F |
1933 |
2.68° F |
2.5° F |
|
1938 |
2.34° F |
2007 |
2.29° F |
These temperatures are how much warmer than normal the average for that year was, in degrees Fahrenheit.
The "industry standard" for this kind of thing, however, is the average (or mean) of each day's high and low temperatures (TMean). When we look at TMean, 2012 comes in as the seventh warmest year.
TMean |
|
1921 |
3.19° F |
1911 |
3.08° F |
1927 |
2.95° F |
1933 |
2.74° F |
1922 |
2.61° F |
1998 |
2.57° F |
2.5° F |
|
1925 |
2.37° F |
1990 |
2.29° F |
1938 |
2.09° F |
And if we plot the state's temperature record from 1890 to the present, it looks like this:
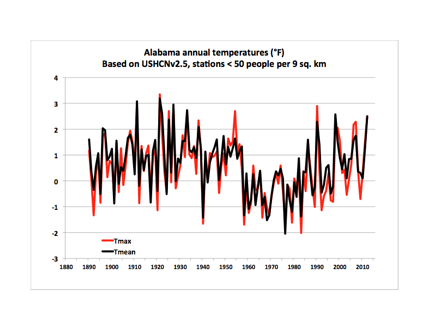
The state's 1890 to 2012 temperature trend is a very slight cooling, 0.05° Fahrenheit per decade. While there have been some noticeable bumps (the 1930s) and dips (the 1960s and '70s), Alabama's climate has been relatively stable when viewed from the perspective of 122 years. Based on NCDC data compiled by the Southeastern Regional Climate Center for TMean, the difference between the hottest (1927 at 67.80° F) and coldest (1976 at 62.38° F) years is 5.42° F.
While there are some differences in the temperatures reported from year to year, that range is consistent with the UAHuntsville calculations. In the rural TMax temperature record, the hottest year (1921) was 3.35° F warmer than the average. The coolest year (1983) was 2.02° F cooler than average. This range is 5.37° F between the hottest and coldest years, being almost the same as the difference reported by the SRCC.
- John Christy