 |
|||||||||||||||||||||||||||||||||||||
Volume1, Number 9, June, 2011 |
|||||||||||||||||||||||||||||||||||||
for more info go to:
|
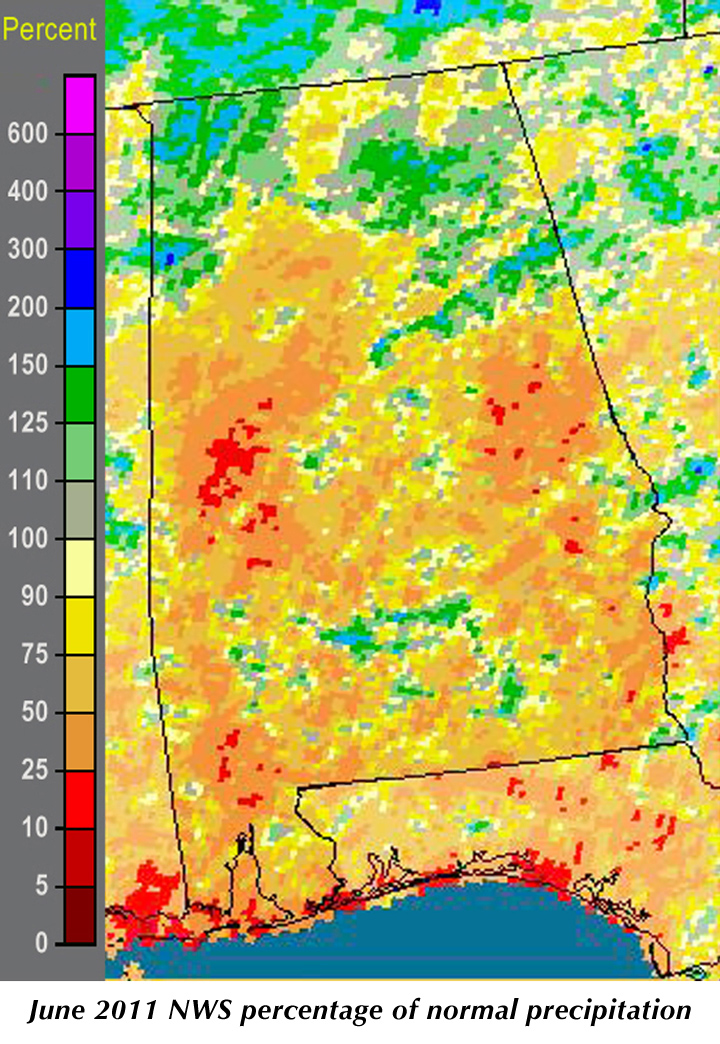
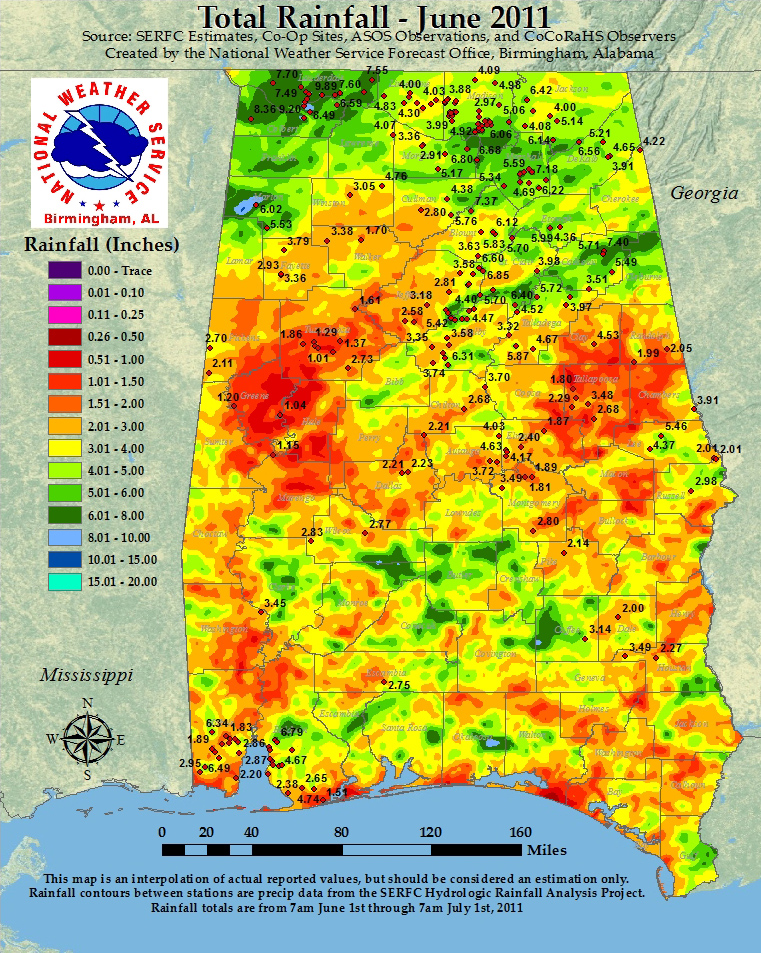
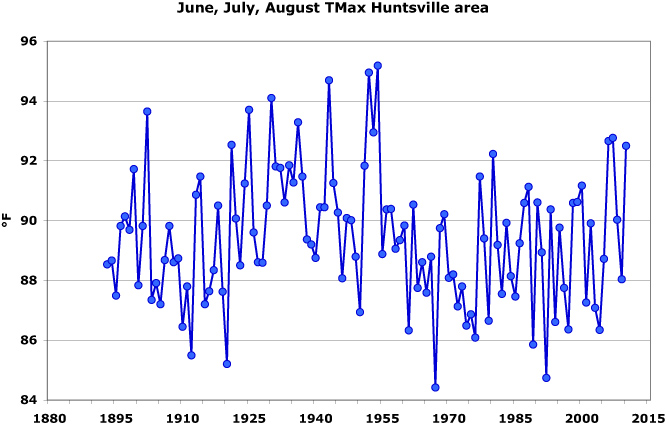
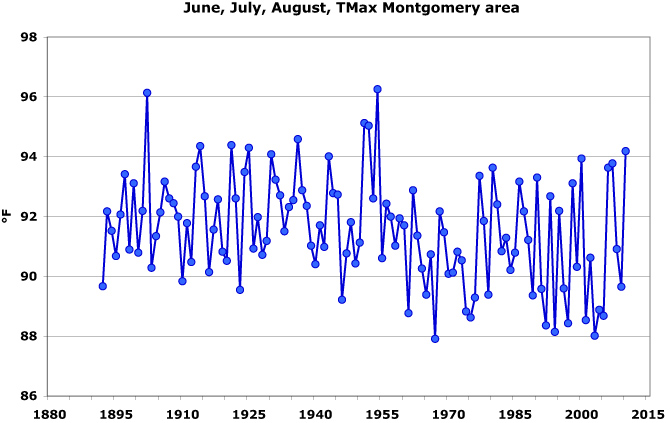
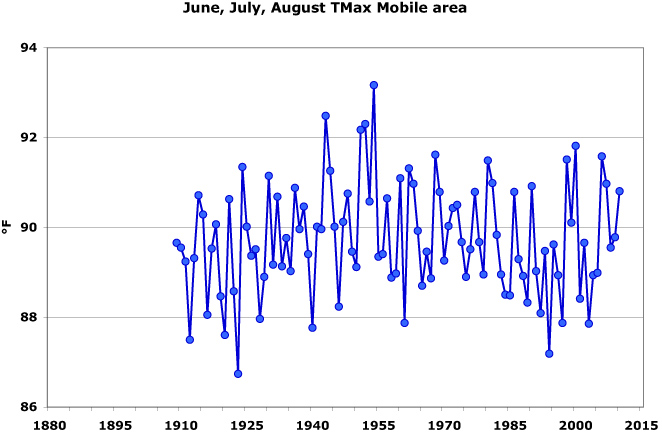
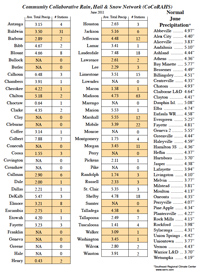
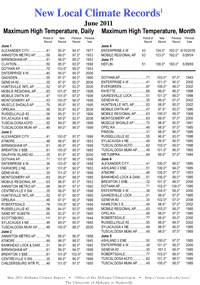
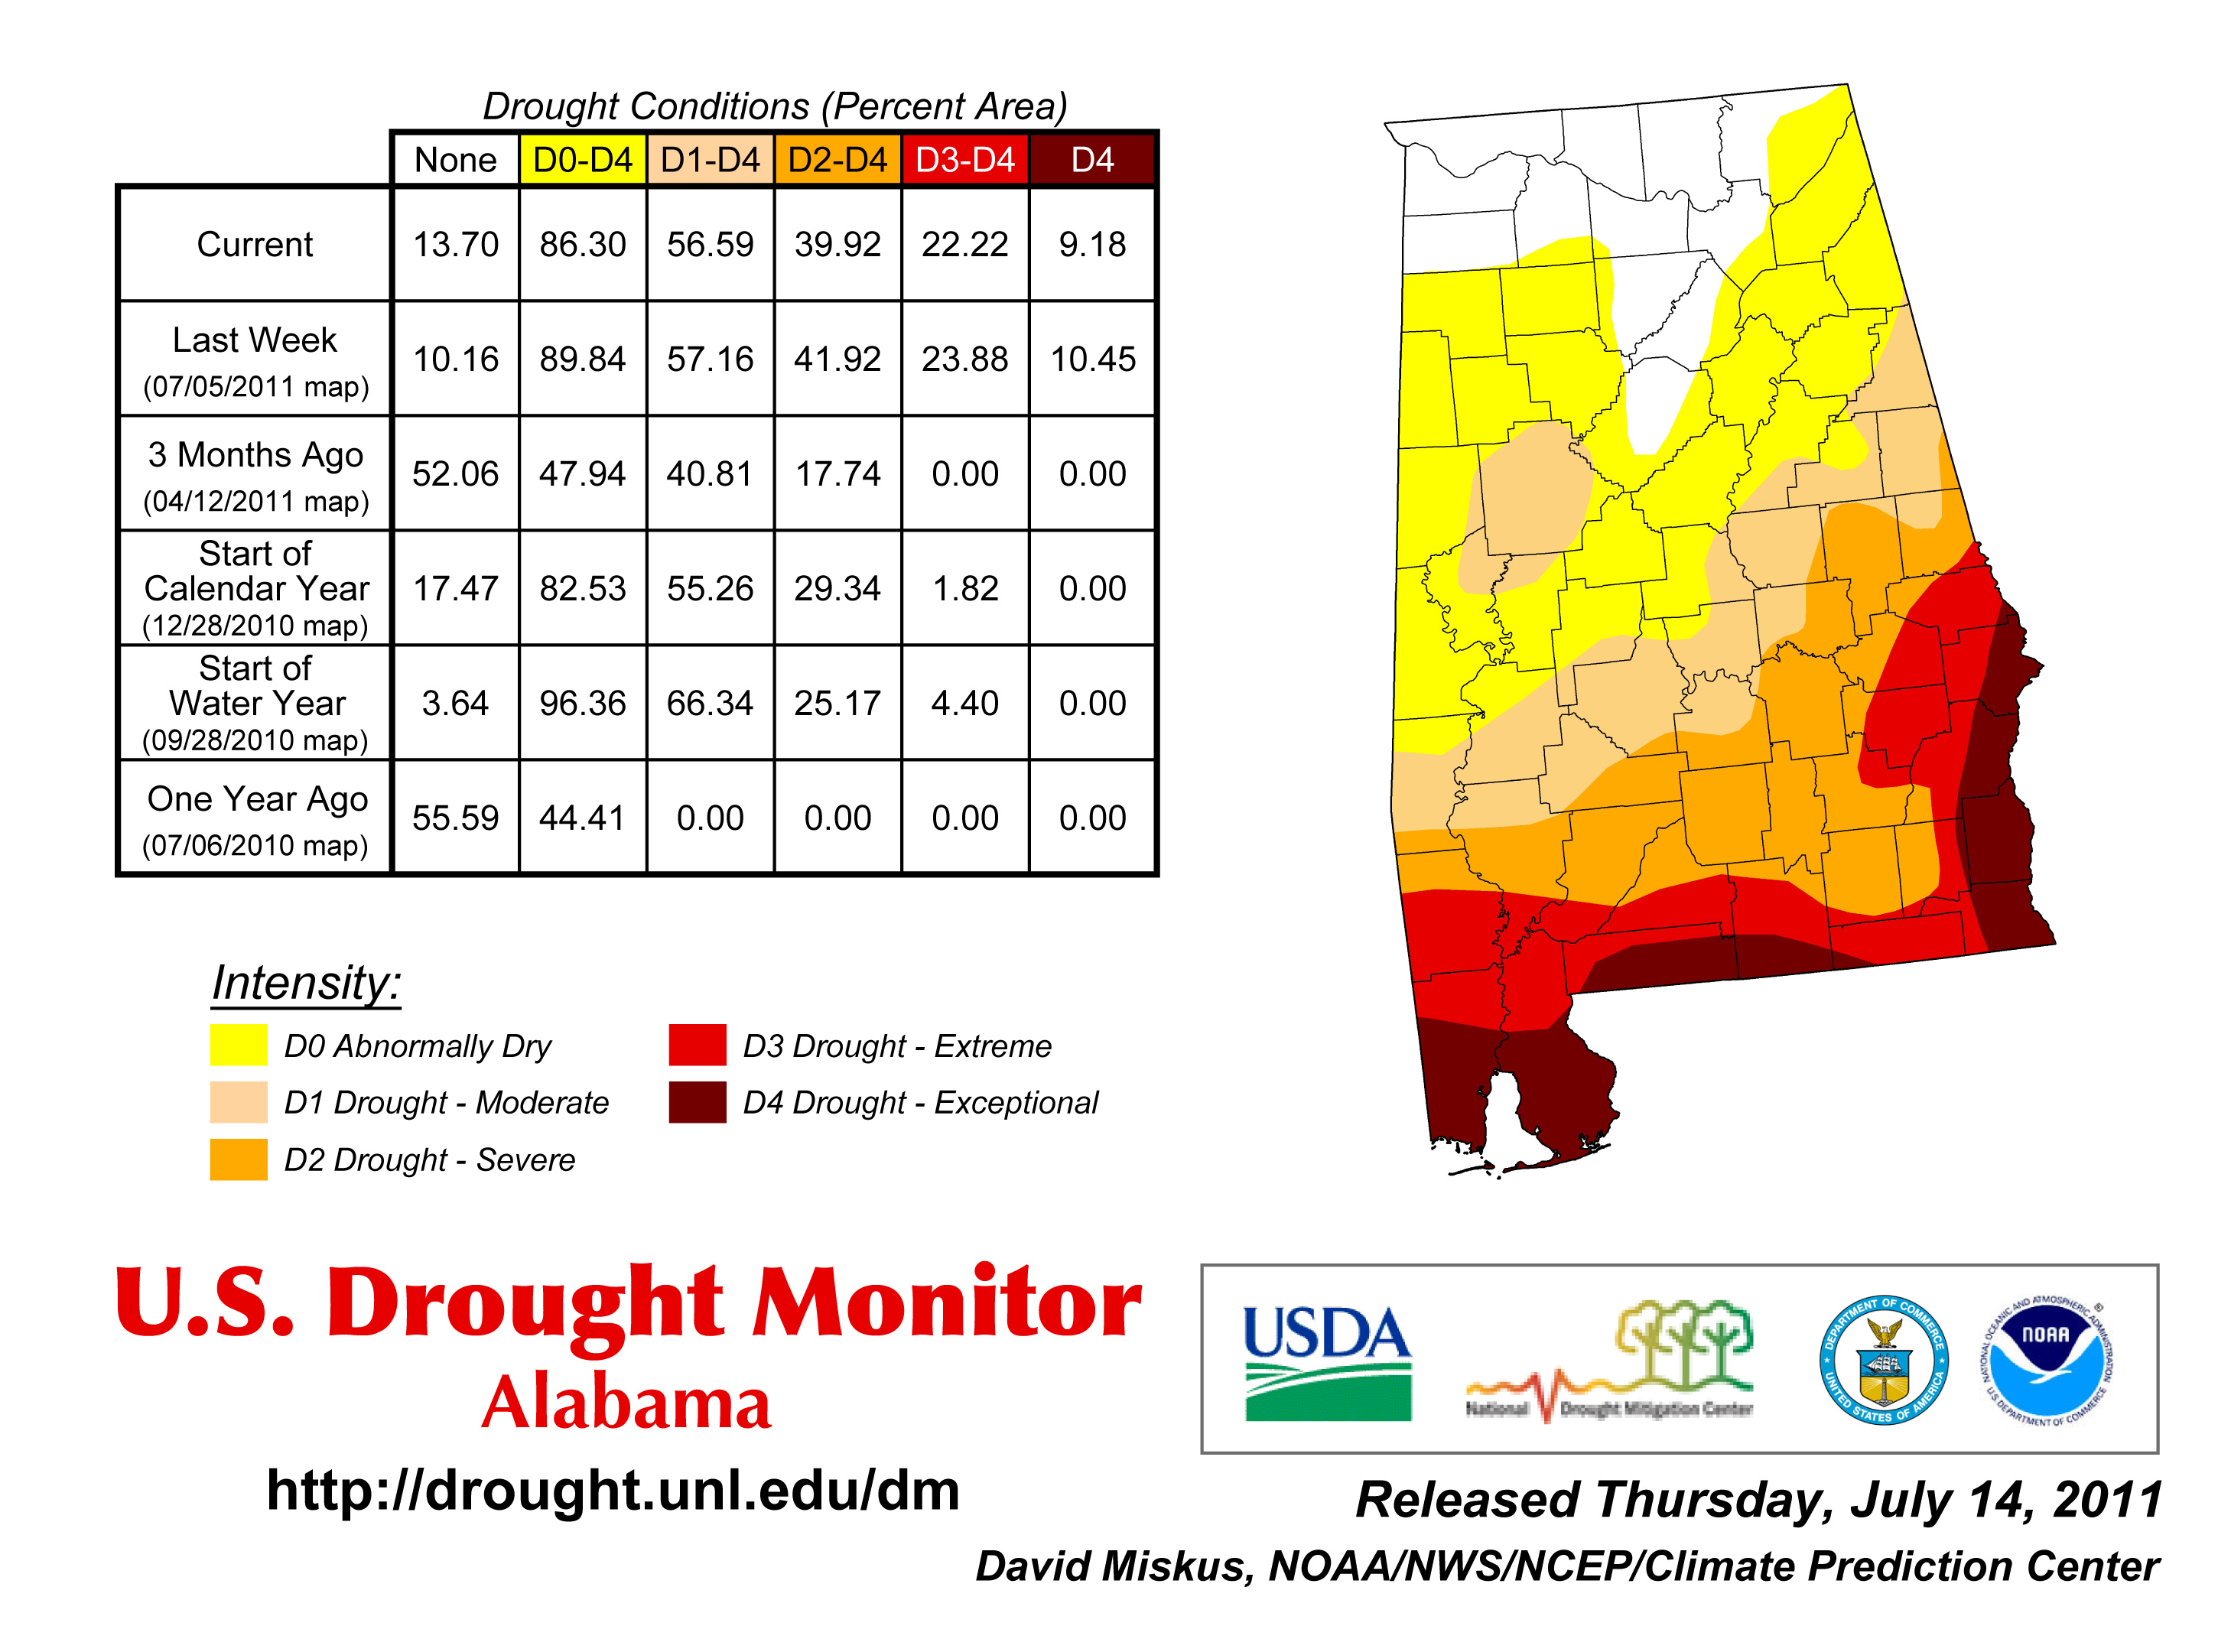
The heat wave during the first half of June put almost the entire state in at least some level of drought designation by June 14, but rain during the second half pulled the Tennessee Valley out of drought. Unfortunately, rain amounts trailed off as one headed south so that in the southern tier of Alabama counties (and most of the state), the drought worsened during June. As we end the month, Alabama has areas in all six drought categories, from no drought in the north to “exceptional” or “D4” (the worst) conditions on the southern edge. As mentioned last month, it may take a tropical storm to pull Alabama’s southern counties into a less serious situation. People in the southern part of the state are watching rain-fed crops fail and water restrictions announced due to the excessive heat and dryness of June. The statistics in this month’s report bear that out: Enterprise, Mobile and Heflin all saw their hottest June temperatures. The 104° reported in Enterprise on June 4 tied that city's all time high temperature mark. I deal with a lot of questions from people who want to know how hot it is compared with previous summers. With the heat wave that started over the Memorial Day weekend and lasting through mid-June, those questions were abundant before the meteorological summer -- defined as June, July and August -- had barely begun. I have been working on finding appropriate answers to these questions because there really is no simple answer. One problem, for instance, is that none of our weather stations have used the same instruments or have been in the same locations or have had the same local environments since we started collecting climate data back in the late 1800s. There are a lot of buildings and parking lots in places where there were none 100 years ago. Whenever instruments change or a station is moved or a building is built nearby, temperature readings are always affected. That means it isn't always valid to compare today’s temperature data with those from 100 years ago without doing a lot of work to figure out why some readings don't "fit." This problem led me to develop a method to combine station data from different time periods. In 2002 I used this technique to "intercalibrate" more than 100 years of temperature for the Huntsville area, then published that new dataset in the "Bulletin of the American Meteorological Society." Since 2002 I have applied an updated methodology to temperature records for the state's four major metropolitan areas (Huntsville, Birmingham, Montgomery and Mobile), so we can put today’s summer heat in perspective. I hope to add other regions in the near future. These are preliminary results, as there are more stations I need to add which are still on old paper forms or microfiche. That information needs to be entered into a digital database. The readings I use are the daytime high temperatures, as this is a reading that is least affected by human development. It’s also a reading people relate to quickly – 95° F is hot and we all know it. Compared with other seasons, summer temperatures have less variability too, so we can see how changes in long-term trends are shaping up. I generate the year-by-year values for a metropolitan area based on stations that fall within circles of increasing radii from the current airport station, from 31 miles to 40 miles to 50 miles (50, 65 and 80 km respectively.) The bigger the circle, the more stations are used to bolster the numbers. The values below are relative to current airport stations and generally begin around 1892, or about 118 years of data, though I only feel comfortable at this point starting in 1909 for Mobile due to questionable early data that I hope to remedy. If we start with Mobile we have 15 stations available within a 40-mile radius and it appears that 1954 was the hottest summer with an average temperature of 93.7° with 1943 second at 92.3° (but when more data are processed before 1909, 1902 may pop up as first or second.) Montgomery, with 17 stations, also shows 1954 as the warmest summer (96.3°), barely ahead of 1902 (96.1°). That is so close (actually only 0.13° difference when you look at hundredths) that the two years were really tied for the hottest. In Birmingham, based on data from 24 stations, 1902 (94.8°) edges out 1954 (94.7°). Again, the difference is not meaningful. In North Alabama, Huntsville and its 28 stations show 1954 (95.2°) as the hottest summer, followed by 1952 (95.0°) with 1902 being sixth. For the four metro areas of Alabama, 1954 and 1902 stand out as benchmarks for heat. Summer 2010 was also a hot one: 35th hottest in Mobile, eighth hottest in Montgomery and Birmingham, and twelfth hottest in Huntsville. If you are looking for the single hottest month, August answers the call for all four regions. In Huntsville and Birmingham it was August 2007 at 98.2° and 97.9° respectively. For Montgomery and Mobile, August of 1954 won the prize at 98.6° and 95.4° respectively. There aren't any really "cool" summers in Alabama's 100+ year temperature record, but there were some summers that weren't as hot. The summer of 1967 stands out as the “coolest” for Huntsville, Birmingham and Montgomery at 84.4°, 85.1° and 87.9° respectively. 1923 was coolest in Mobile at 86.7°, a smidgen below 1994, but stay tuned for possible changes as more data come in. I’ll keep you updated as the summer unfolds, so stay cool. |
|
|||||||||||||||||||||||||||||||||||
| - John Christy | |||||||||||||||||||||||||||||||||||||
|
|||||||||||||||||||||||||||||||||||||
 |
|||||||||||||||||||||||||||||||||||||
| Copyright (c) 2010-2011 Alabama Office of the State Climatologist. All rights reserved. questions about this web page? Contact webmaster. |
|||||||||||||||||||||||||||||||||||||